How to Benchmark vLLM: Find the Best Model, Quant and Settings for Your GPU
In today's post I'm sharing how I benchmark local models on vLLM by changing one thing at a time, along with the traps that quietly skew the numbers and my results from 21 setups on two 48GB RTX 4090Ds. The harness, vllm-bench, is free, so you can run the same tests on your own card.
 Richard Baxter AI Ops & Marketing Engineer
 On this page
- Is it worth benchmarking your own setup?
- What you need before you start
- Your first vLLM benchmark, on one small model
- What to measure (and what to leave alone)
- Change one thing at a time
- The traps that skew vLLM benchmark numbers
- What 21 setups did on two RTX 4090Ds
- Same model, five builds: quantisation on one card
- Speculative decoding: faster, with a catch
- One card or two?
- Speed isn't quality
- vLLM's own benchmark: vllm bench serve
- Run it yourself with vllm-bench
- Gotchas
- My top three for this setup
- Where to go from here
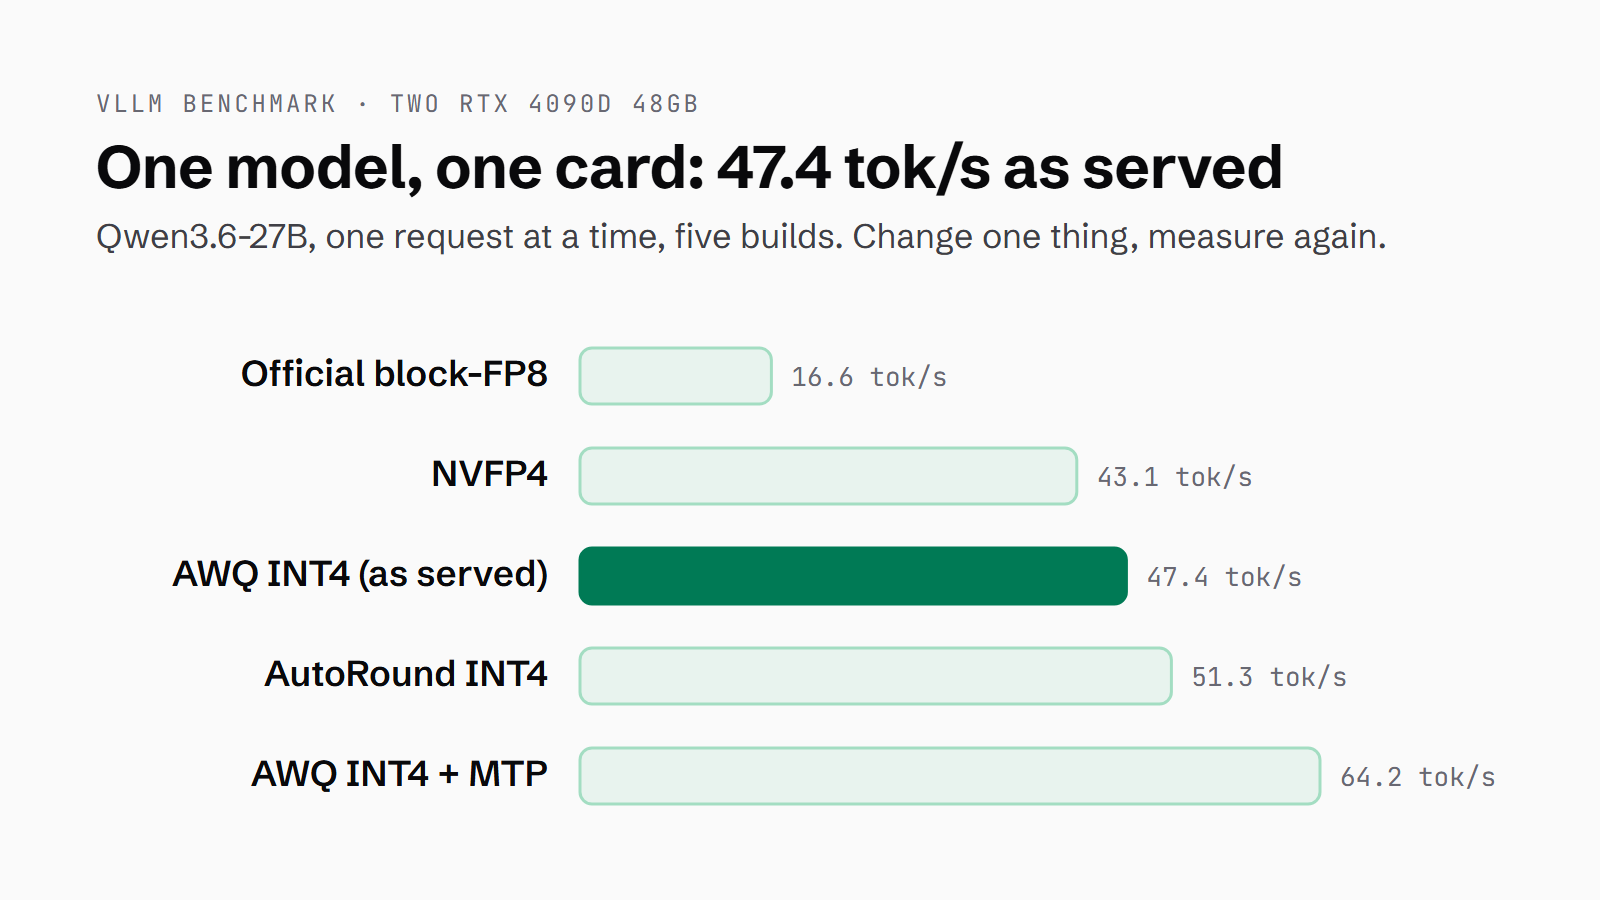
You can start with LM Studio to learn this stuff, and for a Windows user the next step is usually vLLM (an open-source inference server) in a Docker container. Once it's running, you benchmark it by changing one thing at a time, whether that's the model, the quant or a vLLM flag, and measuring what each change does to speed and quality on your own card. When I'm working with clients, I don't tell them they need to start by investing in an array of NVIDIA Blackwell RTX Pro 6000s, because the investment's huge. From an engineering point of view, the discipline is actually making the most out of the equipment you have. What follows is the protocol I use, with my September numbers from two modded 48GB RTX 4090Ds to compare yours against. On one card, the same Qwen3.6-27B went from 16.6 tokens per second (tok/s) on its official block-FP8 build to 47.4 on the 4-bit build I serve for delegated work, and to 64.2 with speculative decoding switched on. The model never changed; only the build and the settings did. I've turned my benchmark script into a free, open-source harness called vllm-bench, and on the smallest model I tested it loaded and finished all three runs in under two minutes.
The harness: vllm-bench on GitHub is free and MIT-licensed, and the results explorer redraws these charts from your own results.csv.
Quick Navigation
Is it worth benchmarking your own setup? |
What you need before you start |
Your first vLLM benchmark, on one small model |
What to measure (and what to leave alone) |
Change one thing at a time |
The traps that skew vLLM benchmark numbers |
What 21 setups did on two RTX 4090Ds |
Same model, five builds: quantisation on one card |
Speculative decoding: faster, with a catch |
One card or two? |
Speed isn't quality |
vLLM's own benchmark: vllm bench serve |
Run it yourself with vllm-bench |
Gotchas |
My top three for this setup |
Where to go from here
Is it worth benchmarking your own setup?
It pays off if you run a local model every day, for coding, extraction or delegating work. It also settles two decisions: which of two quants of the same model to serve, and whether a model gets one card or two. Public leaderboards measure the model. They don't measure your card, your build of the weights or your flags. If you're still finding your feet, LM Studio is the easier place to learn, and we've written a guide on that: how to set up LM Studio. Come back when you've outgrown it.
What you need before you start
You need vLLM already running in Docker. If it isn't, how to set up vLLM walks through the Windows and WSL2 setup, and nothing in the benchmark changes that setup. There are five things to have in place before your first run.
- vLLM in a Docker container, with the image pinned to a version.
- An NVIDIA GPU, on Linux or on Windows with Docker Desktop and WSL2.
- Python 3.11 or newer. The harness uses the standard library only, so there's nothing to pip install.
- The models already downloaded. A named Docker volume works as the models folder.
- A Hugging Face read token, if any of your models sit in gated repos.
Your first vLLM benchmark, on one small model
Clone vllm-bench, write one preset, and run it with --dry-run first. The dry run starts nothing. It prints the exact docker run line the harness would use, which means you can check every flag before a container comes up. The preset file below is the one I used for the first live run, with LFM2.5-1.2B on my second card.
[defaults]
image = "vllm/vllm-openai@sha256:ffb2d59b1c059a5bd8d781320c9f5189de8293693b7d95da54befddaa54abf52"
gpus = "1"
port = 8001
models_dir = "vllm_models"
hf_cache_volume = "vllm_hf-cache"
gpu_memory_utilization = 0.30
kv_cache_dtype = "fp8"
common_args = ["--enable-prefix-caching", "--max-num-batched-tokens", "8192", "--max-num-seqs", "16"]

[[preset]]
name = "lfm2.5-1.2b"
model = "/models/LFM2.5-1.2B-Instruct"
served_name = "lfm2.5-1.2b"
max_model_len = 32768
args = ["--tool-call-parser", "lfm2", "--enable-auto-tool-choice", "--default-chat-template-kwargs", '{"thinking": false}']
Then run it for real, with three passes of every measurement, and draw the charts from the results.
git clone https://github.com/houtini-ai/vllm-bench
cd vllm-bench
# write presets.toml (the file above), then:
python bench.py presets.toml --dry-run
python bench.py presets.toml --runs 3 --keep
python charts.py results/results.csv --out charts/
17:04:47 lfm2.5-1.2b: ready in 64s
17:04:48 lfm2.5-1.2b: filler token count = 31
17:05:02 lfm2.5-1.2b run 3 ctx0: ttft=0.034s decode=309.5 tok/s prefill=1382.4 tok/s
17:05:03 lfm2.5-1.2b run 3 ctx4k: ttft=0.11s decode=309.1 tok/s prefill=35236.4 tok/s
17:05:05 lfm2.5-1.2b run 3 ctx16k: ttft=0.368s decode=299.9 tok/s prefill=41739.1 tok/s
17:05:07 lfm2.5-1.2b run 3 conc4: 1010.3 tok/s
17:05:08 wrote results\results.csv and results\results.mdThe model loaded from the Docker volume in 64 seconds. Decode (generating the answer, one token after another) came out at a median of 309.7 tok/s on a short prompt, 299.9 on a 16k-token prompt, and four requests at once produced 1,010.3 tok/s between them. The spread (the gap between the fastest and slowest of the three runs, as a share of the median) was 0.5%. Against my rig's own sweep of the same model on the same card, the harness landed within 0.4% on decode at all three prompt lengths and on four requests at once. I wanted that check before trusting the harness with a model I care about.
What to measure (and what to leave alone)
Decode speed at three prompt lengths comes first: a short question, about 4k tokens and about 16k tokens. Some models hold their speed as the context fills and some don't. Nemotron-3.5-Lightning-30B went from 161.1 to 160.1 tok/s between a short prompt and a 16k one, while Gemma 4 26B-A4B dropped from 154.4 to 129.9.
Next come time to first token (TTFT, the wait before the first word appears) and prefill (the model reading the prompt, in tok/s), both measured on a cold 16k-token prompt the engine hasn't seen before. Four requests at once shows you how the model behaves as a service rather than for one user. Power draw and peak VRAM round it off, though peak VRAM mostly reflects the memory you told vLLM to claim, not the size of the model. Every speed figure runs three times, the median is the number, and any spread over 3% gets flagged. The one exception in my sweep was the cold 16k prompt, sent once per model, because a repeat of it is no longer cold.
Speed on its own can mislead, so in my sweep three quality gates ran in the same container. There's an 8-field structured extraction, a coding task with 12 test cases, and a tool-calling eval (a check that the model calls the right tool with the right arguments) of 49 cases three times over, 147 in all, at temperature 0.2 and again at 1.15. The coding gate is one task and one sample per model. Read it as a smoke test, not as a measure of coding ability. The gates set those two temperatures themselves. In the speed runs, leave sampling alone: the model's own generation_config.json applies by default, and a temperature sent from the client overrides it on every request without a warning.
Change one thing at a time
Every model in my September sweep ran under one protocol. Both cards were capped at 330W, with the clocks locked, and every row peaked at 2,190 MHz under load. The engine was vLLM 0.26.0, pinned by image digest. Thinking was switched off on the server, with the key each model's template reads. The smallest model went first, on one card if it fitted and on both only if it didn't. Each model got its own container start, torn down before the next one came up.
The serving flags stayed fixed across the whole run. Prefix caching was on (vLLM skips re-reading the start of a prompt it has already seen). Prefill ran in 8,192-token chunks, with up to 16 sequences at a time, 0.92 GPU memory utilisation and an FP8 KV cache (the model's working memory for the conversation, covered in the KV cache explainer). Gemma 4 31B kept a BF16 KV cache for code accuracy, and a benchmark has to record that, because it changes what's being measured. What each flag does, and why those values, is in vLLM settings for twelve local models.
Then change one thing, whether it's the quant, the context cap, the card layout or speculative decoding, and run it again. Over a sweep, that's multivariate settings testing, with one variable moving per run.
The traps that skew vLLM benchmark numbers
The prompt length you think you sent
My old instrument guessed prompt length from character counts. The filler text packed fewer characters into each token than it assumed, so prompts labelled 16,000 tokens were roughly twice that. Some models absorbed it, others refused with an HTTP 400, and every context label was wrong. Now the harness asks each model's server to count the filler with one call to /tokenize before the run. This run's 16k prompts measured 14,866 to 15,494 tokens by the server's own count. Tokenisers differ between models, so the same text isn't the same number of tokens on two of them.
Counting chunks instead of tokens
Under speculative decoding, a single streamed chunk can carry a burst of several verified tokens, so counting chunks under-reads the speed by half or more. Count output tokens from the usage block the engine returns at the end of the stream. Models without speculative decoding send one token per chunk, which is why this one hides until you switch it on.
Timing the wrong channel
gpt-oss-120b streams an analysis channel before its final answer. A timer that starts on the first content token, while the usage block already counts the analysis tokens, divides the full count by too short a window. On my first attempt that read 489, 278 and 379 tok/s across three runs. Timing from the first token on any channel gave 151.2, 151.2 and 151.2, a spread of 0.0%. For models without a reasoning channel, the two measures are identical.
A green /health on a stalled engine
On vLLM 0.26.0, the MTP draft path can stall a cold 16k prefill. The warm-up answers, the long prompt never returns, the GPU sits pinned at 100% and /v1/models keeps answering 200. A readiness probe can't see it. Every request gets its own 300-second timeout, and a trip is recorded as a timeout, never as a speed. The vLLM setup guide has the full signature.
The thinking switch with three names
Qwen, Nemotron, GLM, Bonsai and Gemma take {"enable_thinking": false}. LFM2.5 and gpt-oss take {"thinking": false}. Llama 3.3, Llama 4 and Devstral have no thinking mode, so they get nothing. An unknown key is silently ignored, which means the wrong name leaves the model reasoning anyway and nothing tells you. Set it on the server with --default-chat-template-kwargs, per model. I used to send it from the client to every model, until a near miss moved it to the server.
An unpinned image
vllm/vllm-openai:latest upgraded my rig from 0.25.1 to 0.26.0 on a routine model swap. Every number after that swap was on a different engine from the ones before it. Pin the image by digest, because a digest can't be re-pointed, and record it on every row.
What 21 setups did on two RTX 4090Ds
The chart ranks one build per model by single-stream decode speed, and the other builds of the same models get their own sections further down.
Decode speed, one request at a time
How fast each model writes, and what a long prompt costs it
Bars are tokens per second with a short prompt. The dark tick is the same model with about 15,000 tokens already in the context window.
- LFM2.5-1.2B309.5299.6 at 16k
- LFM2.5-8B-A1B203.9199.6 at 16k
- Nemotron-3.5-Lightning-30B161.1160.1 at 16k
- Gemma 4 26B-A4B154.4129.9 at 16k
- gpt-oss-120b151.2138.4 at 16k
- Nemotron-3-Super-120B63.463.3 at 16k
- Devstral-Small-2-24B60.856.2 at 16k
- Llama-4-Scout51.550.3 at 16k
- Ternary-Bonsai-27B5149.4 at 16k
- Qwen3.6-27B47.446 at 16k
- Gemma 4 31B42.136.5 at 16k
- Qwen3.8-27B35.835 at 16k
- Llama-3.3-70B23.221.8 at 16k
Two modded RTX 4090D 48GB cards (Ada, 96GB), vLLM 0.26.0, 330W cap per card. Median of 3 runs, measured 26 September 2026. Striped bars ran split across both cards.
The top five are LFM2.5-1.2B at 309.5 tok/s, LFM2.5-8B-A1B at 203.9, Nemotron-3.5-Lightning-30B at 161.1, Gemma 4 26B-A4B at 154.4 and gpt-oss-120b at 151.2 across both cards. LFM2.5-8B-A1B and Gemma 4 26B-A4B are MoE models (mixture of experts: the model holds all its parameters but uses only a slice of them per token), and the name tells you the split: LFM2.5-8B-A1B is 8B in total with about 1B active per token. Without speculative decoding, every 4-bit 27B and 31B build on one card lands between 35.8 tok/s for Qwen3.8-27B and 51.3 for the AutoRound Qwen3.6-27B, with the build I serve at 47.4.
Running four requests at once scales very differently from model to model.
One user or a service?
Four requests at once, against one at a time
Light bars are one request; dark bars are the total output of four requests running together.
- LFM2.5-1.2B1006.6309.5 alone
- Gemma 4 26B-A4B439.9154.4 alone
- LFM2.5-8B-A1B439203.9 alone
- gpt-oss-120b351.1151.2 alone
- Nemotron-3.5-Lightning-30B296.9161.1 alone
- Devstral-Small-2-24B237.960.8 alone
- Ternary-Bonsai-27B177.151 alone
- Nemotron-3-Super-120B176.863.4 alone
- Qwen3.6-27B167.547.4 alone
- Gemma 4 31B159.942.1 alone
- Qwen3.8-27B128.135.8 alone
- Llama-4-Scout113.251.5 alone
- Llama-3.3-70B91.123.2 alone
Two modded RTX 4090D 48GB cards (Ada, 96GB), vLLM 0.26.0, 330W cap per card. Median of 3 runs, measured 26 September 2026.
The biggest multiple belongs to the two official block-FP8 27Bs, which aren't on this chart: 16.6 to 77.1 tok/s, 4.64x. I take that to mean one stream leaves the card partly idle on that kernel. Lightning manages 1.84x, from 161.1 to 296.9. Four-at-once requests take 256 output tokens against 400 for a single stream, so the multiples are approximate.
The efficiency chart divides decode speed by power: the working card only for one-card models, both cards summed for two.
Efficiency
Tokens per second for every watt the cards draw
Short-prompt decode speed divided by the median GPU draw across the measurement runs. One-card models count the working card only; two-card models count both.
- LFM2.5-1.2B1.36tok/s per W
- LFM2.5-8B-A1B0.97tok/s per W
- Nemotron-3.5-Lightning-30B0.82tok/s per W
- Gemma 4 26B-A4B0.74tok/s per W
- gpt-oss-120b0.46tok/s per W
- Devstral-Small-2-24B0.21tok/s per W
- Ternary-Bonsai-27B0.19tok/s per W
- Qwen3.6-27B0.17tok/s per W
- Gemma 4 31B0.16tok/s per W
- Nemotron-3-Super-120B0.15tok/s per W
- Llama-4-Scout0.13tok/s per W
- Qwen3.8-27B0.13tok/s per W
- Llama-3.3-70B0.08tok/s per W
Two modded RTX 4090D 48GB cards (Ada, 96GB), vLLM 0.26.0, 330W cap per card. Median of 3 runs, measured 26 September 2026.
LFM2.5-1.2B leads at 1.363 tok/s per watt. Among the larger models, Lightning reaches 0.822 and Gemma 4 26B-A4B 0.735, against 0.173 for the served 27B. Power is a median over the whole measurement phase, not pure decode, and every card was capped at 330W, so these figures compare models with each other, not with a stock card.
A few models have no row. GLM-4.7-Flash doesn't complete a prompt longer than one 8,192-token prefill chunk on vLLM 0.26.0, which is an engine bug. Qwen3-Coder-Next 80B didn't fit on the disk: its repo is 86.9 GB and the volume had 85 GB free. Three more were no longer on disk, and one architecture isn't in the pinned engine at all.
Same model, five builds: quantisation on one card
The chart below holds the model still: Qwen3.6-27B, one card, one stream, five builds.
Same model, same card, five builds
Qwen3.6-27B: 47.4 tokens per second as served, 16.6 to 64.2 across the builds
- Official block-FP816.6 tok/s
- NVFP443.1 tok/s
2.6x the block-FP8 build
- AWQ INT4 (as served)47.4 tok/s
2.9x the block-FP8 build
- AutoRound INT451.3 tok/s
3.1x the block-FP8 build
- AWQ INT4 + MTP speculative decoding64.2 tok/s
3.9x the block-FP8 build; varied 5% run to run
Two modded RTX 4090D 48GB cards (Ada, 96GB), vLLM 0.26.0, 330W cap per card. Median of 3 runs, measured 26 September 2026.
The official block-FP8 build (8-bit weights, scaled in blocks) is the slow one, at 16.6 tok/s. The three 4-bit builds sit much closer together: NVIDIA's NVFP4 format runs at 43.1, AWQ INT4 (a 4-bit quantisation that protects the weights that matter most) at 47.4, and Intel's AutoRound INT4 at 51.3. AWQ is the build I serve, and going from block-FP8 to AWQ took the model from 16.6 to 47.4 tok/s, 2.9x. With MTP on top, the same AWQ build reaches 64.2.
Block-FP8 on a consumer card is the kernel trap. Qwen3.6-27B and Qwen3.8-27B on their official block-FP8 checkpoints both read 16.6, 16.5 and 16.4 tok/s across the three prompt lengths, and both 77.1 at four at once, yet their quality scores differ. They're different models on the same slow kernel. vLLM says as much in its log: "Using default W8A8 Block FP8 kernel config. Performance might be sub-optimal!" The card draws about 218W, well under its 330W cap. Block-FP8 does have the fastest 16k prefill of the 27B builds (3,483 and 3,487 tok/s); decode is where it loses.
NVFP4 loads and runs on Ada, but it isn't quick there: 9% slower than AWQ, with 6/8 on extraction against 8/8. AutoRound is 8% faster than the AWQ build, with the same 12/12 and 8/8 gates and a slightly lower tool score, 114/147 against 120/147. It's the first time I've measured it, so the 8% rests on one sweep. Qwen3.8-27B on the same AWQ INT4 format runs at 35.8 tok/s on one card, 24.5% slower than Qwen3.6-27B. Nothing in my data says why.
Speculative decoding: faster, with a catch
Speculative decoding drafts a few tokens ahead and has the model check them in one pass, so more than one token can land per step. MTP (multi-token prediction) is the method used here, drafting two tokens at a time.
On Qwen3.6-27B, MTP took single-stream decode from 47.4 to 64.2 tok/s, 1.35x, and four at once from 167.5 to 196.8. The catch is consistency. Decode spread rose to 5.0% on a short prompt and 10.5% at 16k, because how many drafted tokens get accepted varies with the content. The first four-at-once run read 87.6, against 196.8 and 204.5 for the other two. A repeat 16k prompt took 1.32 s to first token, against 0.69 s without MTP, and the coding sample dropped to 9/12, though one sample is no verdict.
It came through its one run with 0 deadlocks, and one run tells you very little. On this engine, MTP can stall on a long cold prefill while /health stays green, which is why the build I serve for delegated work has it switched off.
One card or two?
Tensor parallel (TP2) splits every layer across both cards. Pipeline parallel (PP2) gives each card half the layers, one after the other. Qwen3.8-27B AWQ INT4 ran on one card and both ways across two, and the chart below sets the three side by side.
Card layout, one model
Qwen3.8-27B on one card, split across two, and pipelined across two
Qwen3.8-27B AWQ, one request at a time and four at once. Light bars: one request. Dark bars: four at once.
- One card35.8 / 128.1 tok/s
Cold 16k first token (one measurement): 6.70 s
- Both cards, tensor parallel50.3 / 163.4 tok/s
Cold 16k first token (one measurement): 9.05 s. +40.5% alone, +27.6% at four, against one card; varied 15.3% run to run
- Both cards, pipeline parallel33.5 / 119.9 tok/s
Cold 16k first token (one measurement): 5.29 s. -6.4% alone, -6.4% at four, against one card
Two modded RTX 4090D 48GB cards (Ada, 96GB), vLLM 0.26.0, 330W cap per card. Median of 3 runs, measured 26 September 2026.
Alone, it decoded at 35.8 tok/s on one card, 50.3 on TP2 and 33.5 on PP2. At four at once, it managed 128.1, 163.4 and 119.9. So TP2 buys 40% on a single stream and 28% at four, though its single-stream runs spread 15.3%, with the first at 45.0 and the other two at 52.7 and 50.3. PP2 is slower on decode both ways.
TP2's cost is prefill. Cold time to first token on a 16k prompt went from 6.70 s on one card to 9.05 s on two, and prefill fell from 2,300 to 1,704 tok/s. PP2 went the other way on prefill, at 2,912 tok/s and 5.29 s. TP2 also buys speed rather than efficiency: 0.393 tok/s per watt at four, against 0.453 on one card. My second card sits on a PCIe x4 link, so all of TP2's traffic between the cards crosses it. My reading is that the link taxes prefill more than decode, but I haven't measured its exact cost.
The two-card rows come with one caveat: they launched without --disable-custom-all-reduce and NCCL_P2P_DISABLE=1, which my production two-card presets carry, so a production launch of the same model may read differently.
Speed isn't quality
Set each model's speed against its tool-calling score and the order changes.
Speed against quality
The fastest model isn't the best tool-caller
Across: decode tokens per second, short prompt. Up: share of 147 tool-calling checks passed at temperature 0.2. Models launched without a tool parser aren't plotted.
Two modded RTX 4090D 48GB cards (Ada, 96GB), vLLM 0.26.0, 330W cap per card. Median of 3 runs, measured 26 September 2026. The y axis starts at 60% to separate the points.
Gemma 4 31B QAT is one of the slower models at 42.1 tok/s, and it scored 147/147 on tool calls at temperature 0.2 and 144/147 at 1.15. It was the only model close to insensitive to temperature. Nemotron-3.5-Lightning-30B pairs 161.1 tok/s with 12/12 on coding and 123/147 on tools. LFM2.5-1.2B is the fastest model I measured, yet it scored 5/8 on extraction and 6/12 on coding, where it rejected every valid input. Five models are missing from this chart because they were launched without a tool parser (the vLLM setting that turns a model's output into a tool call), so their raw tool-eval counts aren't scores.
vLLM's own benchmark: vllm bench serve
vLLM ships its own serving benchmark, vllm bench serve. I ran it inside the harness's own container, which --keep leaves running after the benchmark: 50 prompts, 1,024 tokens in and 256 out, four at a time, with this command.
docker exec vllm-bench-lfm2.5-1.2b vllm bench serve --backend vllm --host 127.0.0.1 --port 8000 --endpoint /v1/completions --model lfm2.5-1.2b --tokenizer /models/LFM2.5-1.2B-Instruct --dataset-name random --random-input-len 1024 --random-output-len 256 --num-prompts 50 --max-concurrency 4 --ignore-eos --seed 0 --percentile-metrics ttft,tpot,itl,e2el --metric-percentiles 50,90,99============ Serving Benchmark Result ============
Successful requests: 50
Failed requests: 0
Maximum request concurrency: 4
Benchmark duration (s): 14.38
Total input tokens: 51200
Total generated tokens: 12800
Request throughput (req/s): 3.48
Output token throughput (tok/s): 890.20
Peak output token throughput (tok/s): 991.00
Peak concurrent requests: 8.00
Total token throughput (tok/s): 4451.01
---------------Time to First Token----------------
Mean TTFT (ms): 86.81
Median TTFT (ms): 82.59
P50 TTFT (ms): 82.59
P90 TTFT (ms): 84.64
P99 TTFT (ms): 338.62
-----Time per Output Token (excl. 1st token)------
Mean TPOT (ms): 4.01
Median TPOT (ms): 3.95
P50 TPOT (ms): 3.95
P90 TPOT (ms): 4.16
P99 TPOT (ms): 4.29
---------------Inter-token Latency----------------
Mean ITL (ms): 4.01
Median ITL (ms): 3.93
P50 ITL (ms): 3.93
P90 ITL (ms): 4.15
P99 ITL (ms): 4.43
----------------End-to-end Latency----------------
Mean E2EL (ms): 1108.33
Median E2EL (ms): 1089.58
P50 E2EL (ms): 1089.58
P90 E2EL (ms): 1097.80
P99 E2EL (ms): 1346.48
==================================================All 50 requests succeeded in 14.38 s. Output throughput was 890.20 tok/s, with a median time to first token of 82.59 ms (338.62 ms at P99), a median time per output token (TPOT) of 3.95 ms and a median end-to-end latency of 1,089.58 ms.
That 890 doesn't contradict the harness's 1,010 at four at once, because it's a different workload. vllm-bench sends short prompts and takes 400 tokens out; this run sends 1,024 tokens in and takes 256 out. A TPOT of 3.95 ms works out at about 253 tok/s per stream under four-way load, against about 309 for a single stream.
In this build, vllm bench serve --help prints a summary and --help=all lists every flag. --endpoint defaults to /v1/completions. If the served model name isn't a Hugging Face repo id, point --tokenizer at the model folder. And it no longer forces greedy decoding: its own warning says sampling now comes from the server side, which fits leaving sampling to the model's own config.
Run it yourself with vllm-bench
vllm-bench is a Python harness in two files, bench.py and charts.py, and it needs nothing beyond the standard library. It benchmarks open-weight models served by vLLM in Docker, one configuration at a time, under one fixed protocol. It records decode at three context lengths, prefill, cold TTFT, four-at-once throughput, power draw and peak VRAM, and reports the median of three runs with its spread. You copy presets.example.toml to presets.toml and add one block per model. charts.py draws the speed ranking, one request against four and tok/s per watt from any results.csv, plus speed against quality when the CSV carries quality scores. Eighteen offline tests run against a fake server with no GPU. A preset that completed cleanly is skipped unless you pass --force, which means an interrupted sweep picks up where it stopped.
The repo also holds the results from my September rig sweep, converted to the harness's CSV format. The results explorer shows them, and it loads your own results.csv and redraws the charts in the browser, with nothing uploaded.
- The harness, example presets and tests: github.com/houtini-ai/vllm-bench
- The results explorer (load your own results.csv): houtini-ai.github.io/vllm-bench
Gotchas
The first three caught me out on this rig, and I'm sharing them so you don't have to go through the same thing. The fourth is plain hygiene.
Git Bash rewrites container paths
docker exec ... vllm bench serve failed on my first try, with an endpoint of C:/Program Files/Git/v1/completions and a tokenizer "repo id" error. Git Bash on Windows rewrites anything that looks like a Unix path, including /v1/completions and /models/... inside the container, before Docker passes it in. Set MSYS_NO_PATHCONV=1 for the command and it runs cleanly.
Load times that aren't the model
A Windows folder bind-mounted into a WSL2 container arrives over 9P, and vLLM logs that auto-prefetch is disabled because it doesn't recognise the filesystem. Models load far slower from there. Move the weights into a Docker volume on ext4. Every configuration in my September sweep loaded in 61 to 243 seconds from the volume, both 120B models included. The vLLM setup guide has the before and after. It isn't the PCIe x4 slot, either; I'd blamed that once, and it was the filesystem.
Two containers starting at once
Two vLLM containers started together each profile memory at 0.92 utilisation during start-up, and it's the concurrent start-up that crashes. The same two models coexist once they're loaded. Start one, wait for /v1/models, then start the next. The harness only ever runs one configuration at a time.
A served port left exposed
vllm-bench publishes vLLM's port on 127.0.0.1 only, 8001 in the preset above, so nothing else on your network can reach it. It also tears the container down after each preset unless you pass --keep. The risk is a server you start by hand: a plain docker run -p 8001:8000 publishes the port on every network interface, and so does setting bind = "0.0.0.0" in a preset. Keep that port behind your firewall, or stop the container when you've finished with it. Leave it open to the network and it's somebody else's free compute.
My top three for this setup
These are the three I'd point you at on a pair of 48GB cards, and what each one is for.
| Model | tok/s alone | tok/s, four at once | Extraction | Coding | Tool calls (0.2) | For |
|---|---|---|---|---|---|---|
| Gemma 4 26B-A4B | 154.4 | 439.9 | 8/8 | 12/12 | 135/147 | the all-rounder on one card |
| Nemotron-3.5-Lightning-30B | 161.1 | 296.9 | 7/8 | 12/12 | 123/147 | speed and long prompts |
| Gemma 4 31B QAT | 42.1 | 159.9 | 8/8 | 12/12 | 147/147 | tool calls that have to be right |
| Qwen3.8-27B | 35.8 | 128.1 | 7/8 | 12/12 | 128/147 | what I run: accuracy over speed |
Gemma 4 26B-A4B (QAT, AWQ INT4) is the all-rounder on one card. It decodes at 154.4 tok/s alone and 439.9 at four at once, scores 8/8 on extraction, 12/12 on coding and 135/147 on tool calls at 0.2, and draws 210W. Where it gives ground is long prompts: it drops to 129.9 tok/s at 16k, the steepest fall of any model I measured.
Nemotron-3.5-Lightning-30B (FP8) is the one for speed and long prompts. It holds 161.1 tok/s alone and 160.1 at 16k, reaches first token on a cold 16k prompt in 1.62 s, scores 12/12 on coding and draws 196W. It gives a little back on accuracy, with 7/8 on extraction and 123/147 on tools.
Gemma 4 31B QAT is the pick when tool calls have to be right: 147/147 at 0.2 and 144/147 at 1.15, with 8/8 on extraction and 12/12 on coding. It pays for that in speed, at 42.1 tok/s.
What I run myself
None of those three is what I run myself. Qwen3.8-27B is the core of the voice agent we're building. The earlier 27B was a good sweet spot, but accuracy-wise, 3.8 is worth the performance trade-off. On my numbers it's 35.8 tok/s alone and 128.1 at four, with 128/147 on tools at 0.2 against 120 for Qwen3.6-27B. It's level on coding and a little behind elsewhere: 7/8 on extraction against 8/8, and 117/147 on tools at 1.15 against 119. The accuracy call is mine, made on my own workload, and three gates don't prove it. I'm looking forward to the right quant of Qwen 4 when it's released.
If you can give it both cards, gpt-oss-120b runs at 151.2 tok/s with 138/147 on tools. For a Qwen workload on one card, Qwen3.6-27B AutoRound runs at 51.3 with 8/8 on extraction and 12/12 on coding, level with AWQ.
Where to go from here
Clone the repo, start with a dry run, and put the smallest model you have through it first.
git clone https://github.com/houtini-ai/vllm-bench
cd vllm-bench
python bench.py presets.example.toml --dry-run
Once your own presets have run, load your results.csv into the explorer, which redraws the charts from your numbers, with a reset button to bring mine back. For the flags, read vLLM settings for twelve local models; for VRAM, the KV cache explainer; for two cards, the dual RTX 4090 96GB runbook.
Continue reading.
- How-to GuidesClaude Code Memory: How to Keep It Useful
- How-to GuidesHow to set up an MCP gateway with Docker
- How-to GuidesHow to Use the Gemini API (and Why I Run It Next to Claude)
- AI ToolsHow to do an SEO audit with Claude
- How-to GuidesClaude Code API Key Security with 1Password: A Guide to Token Hygiene
- ExplainerWhat is a Marketing Engineer (and do you need one)?