How to Use AI for Market Research with Claude
I gave Claude a market researcher's brief and a fixed list of tools, and it came back with a 12-page sourced report on the sim racing hardware market. Every figure went through a script that checked it against its source, and when Gemini looked for the reported ones itself, it caught one that was wrong and led the run to Simucube's company accounts. The whole run is saved as one prompt for a quarterly re-run, and a capped headless test rebuilt the report unattended in 39 minutes.
 Richard Baxter AI Ops & Marketing Engineer
 On this page
- Can you use AI for market research?
- What you need before you start
- The brief that starts the run
- Desk research: filings first, analyst reports last
- Add search data: demand, share of search and prices
- Fact-check every figure before it goes in
- Build the PDF from the data files
- Re-run it every quarter with one prompt
- Gotchas
- Where to go from here
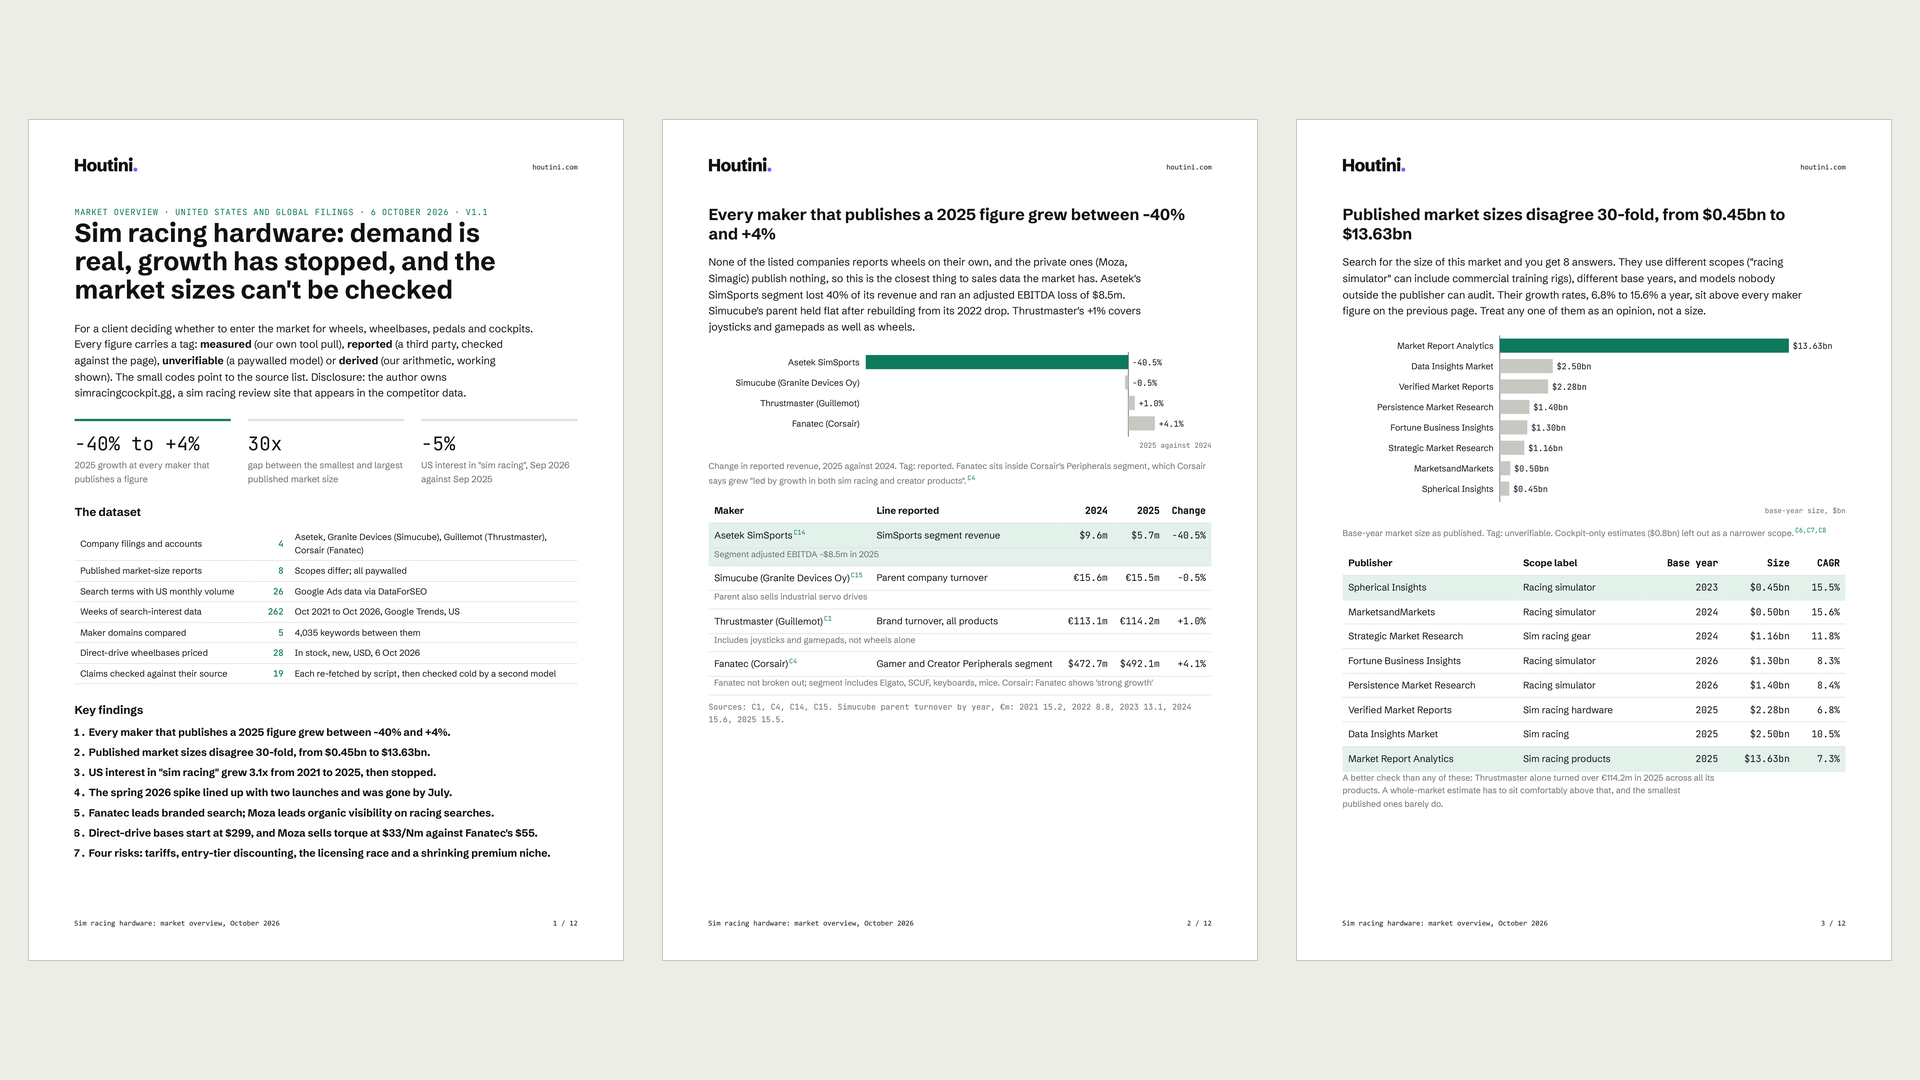
Most of a market overview is legwork. You find the numbers, then you prove where every one of them came from, and that second part is where an AI answer lets you down: the figures arrive with confidence and a source, and the source often doesn't say what the answer claims.
This guide sets up Claude Code to do the legwork and check it. You end with a sourced market report as a PDF. Claude builds it from a fixed sequence of tool calls and tags every figure. A script re-checks each one against its source, a second model re-finds the reported ones cold, and the whole run is saved as a prompt you can re-run each quarter.
My worked example is a 12-page report on the sim racing hardware market, which I built on 6 October 2026. The DataForSEO calls for the whole run cost $0.37, and Firecrawl used 59 of its 1,000 free monthly credits.
The run goes brief > desk research > search data > ledger > checks > PDF. In my run, Gemini disputed one claim and was right: Simucube's parent files public accounts in Finland, and chasing that turned up its turnover by year and then Asetek's segment figures.
Quick Navigation
Can you use AI? |
What you need |
The brief |
Desk research |
Search data |
Fact-check |
The PDF |
Every quarter |
Gotchas |
Next steps
Can you use AI for market research?
Yes, for the legwork. Pulling filings, search data and published figures into one place, and then checking each one, is work Claude Code can do once it has the right tools connected. Where it goes wrong is the sourcing.
A May 2026 paper, "Cited but Not Verified", found frontier models kept their links over 94% valid, but only 39-77% of their claims were factually accurate against the source they cited, and accuracy fell as the number of tool calls went up. The Tow Center study for the Columbia Journalism Review asked eight AI search tools to identify the source of news excerpts, 1,600 queries in all, and got incorrect answers to more than 60% of them. GPTZero went through EY Canada's report on loyalty-system fraud and counted 19 of its 27 references as hallucinated. So a working link isn't a supported claim, which means the checking has to be built into the run itself.
This pays off for a market overview or competitor brief you'll produce again, or one a client is going to act on. A quick question doesn't need any of it.
What you need before you start
Most of the tools below arrive in Claude Code as MCP servers (an MCP server is a small program that gives Claude a new set of tools to call). The search data comes from DataForSEO, a pay-as-you-go API, through SEO Audit Console. Here's the list, with the cost where there is one:
- Claude Code on a paid plan. The run used 2.1.232; the latest on npm is 2.1.291. If yours is older than 2.1.219, update before the headless step, because the check for failed MCP servers,
mcp_server_errors, needs it. If you're signing up to Claude for this, new accounts get a free week of Claude Code. New to it? Start with the Claude Code beginners guide. - SEO Audit Console (@houtini/seo-audit-console, Node 20+). The market tools only need your DataForSEO login. The DataForSEO MCP guide covers the account and its setup.
- A DataForSEO account. A $1 trial credit, then a $50 minimum top-up.
- Firecrawl MCP for reading pages and PDFs. The free tier gives 1,000 credits a month. Setup is in how to use Firecrawl.
- A web search tool. The run used the Brave Search MCP.
- gemini-mcp (@houtini/gemini-mcp) with a billing-enabled Gemini API key, which grounding needs.
- Python 3, for the two scripts.
- A house-style Skill for the PDF, plus Playwright for printing it.
- Optional: a product catalogue for prices. Any price source works.
Add the three servers this guide leans on with these lines, swapping in your own keys:
claude mcp add seo-audit-console -s user -e DATAFORSEO_USERNAME=you@example.com -e DATAFORSEO_PASSWORD=your-password -- npx -y @houtini/seo-audit-console
claude mcp add firecrawl -s user -e FIRECRAWL_API_KEY=fc-YOUR_API_KEY -- npx -y firecrawl-mcp
claude mcp add -e GEMINI_API_KEY=your-api-key-here -s user gemini -- npx -y @houtini/gemini-mcp
The brief that starts the run
Write the brief the way a market researcher briefs an analyst. Say what the client is deciding, list the five things they need (size and growth, the players and how share splits, price bands, demand, risks), ask for a source behind every number, and ask for estimates to be marked. Then ask for a second source on every figure and say what the PDF should look like.
The example market is sim racing hardware: wheels, wheelbases, pedals and cockpits. It's a market I know well, which meant I could sanity-check what came back. That comes with a disclosure: I own simracingcockpit.gg, and it turns up in the competitor data further down.
As it happens, there are two lines in the brief that set up the checks later on: "Mark anything you estimated rather than found" becomes the tag on every row of the claims ledger, and "check every figure with a second source" becomes the ledger's second-source column and the second model's cold check. This is the brief, as I pasted it into Claude Code:
I'm preparing a market overview of the sim racing hardware market (wheels, wheelbases,
pedals and cockpits) for a client deciding whether to enter it. I need: the size of the
market and how fast it's growing, the main players and how share splits between them,
price bands, what customers are searching for and how that demand is moving, and the
risks. Every number needs a source I can open and check - say where each one comes from,
and mark anything you estimated rather than found. Use the search data tools for demand
and share of search, the web for filings and reports, and check every figure with a second
source before it goes in. Deliver it as a PDF report in our house style: key findings first,
then the evidence, a method section and a source list.
Desk research: filings first, analyst reports last
I had Claude run the desk research with web search and Firecrawl. Start with what each company has filed, because a results release or a set of registered accounts is the company's own figure, and only then go looking for the published market sizes.
Open the primary source for every company
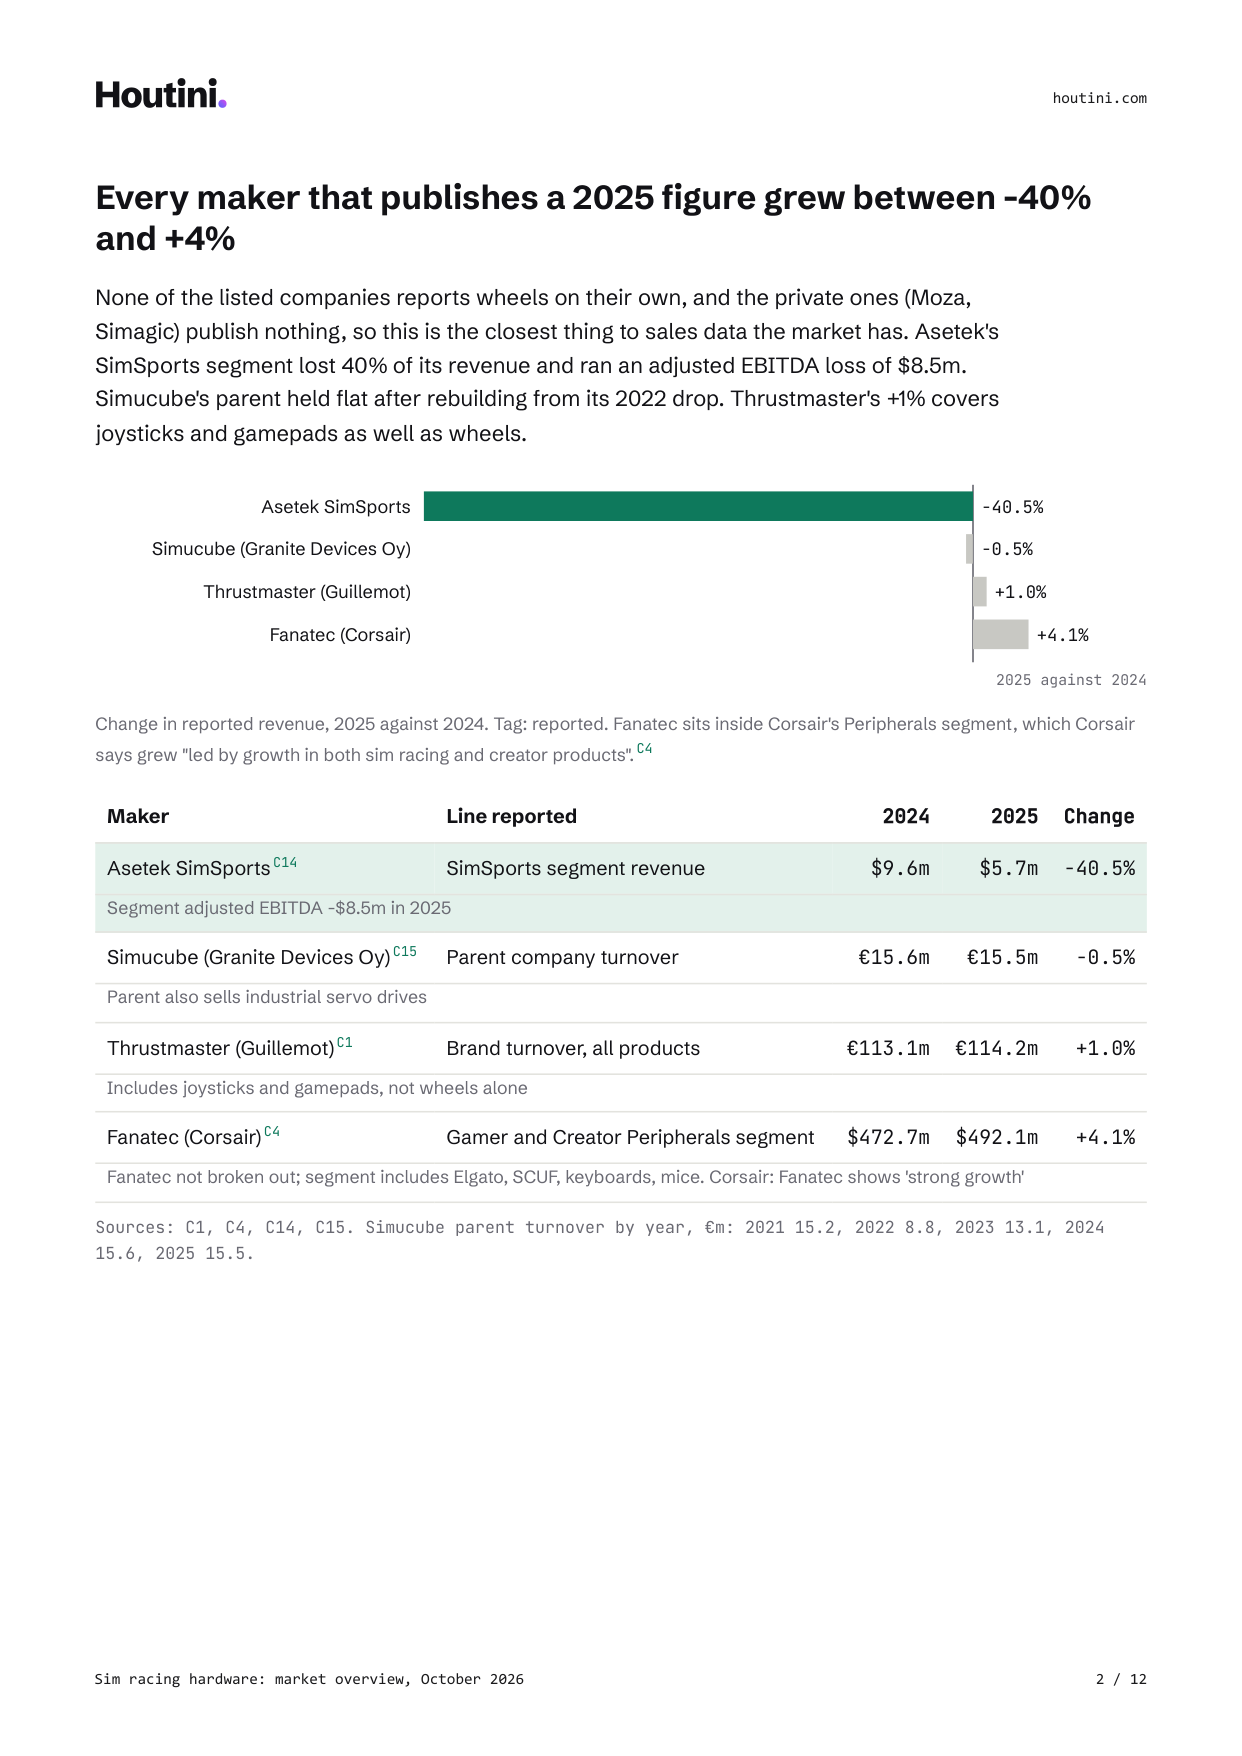
Read each filing for what its figure covers. Guillemot Corporation's 2025 annual results put Thrustmaster's turnover at €114.2m, up 1%, but that's every Thrustmaster product, joysticks and gamepads included. Corsair Gaming reported its Gamer and Creator Peripherals segment at $492.1m for FY2025, up 4%, "led by growth in both sim racing and creator products", and it doesn't break out Fanatec. Asetek's 2025 annual report has a segment note for SimSports: $5.709m, against $9.594m in 2024, which is down 40%. Simucube's parent, Granite Devices Oy, is Finnish, and its accounts on the Finnish trade register, read through asiakastieto.fi, show €15.49m, down 0.5%. The Simucube and Asetek figures both came in later, during the fact-check.
Every maker that publishes a 2025 figure grew between -40% and +4%. The private ones, Moza and Simagic, publish nothing.
Collect the market-size reports and line them up
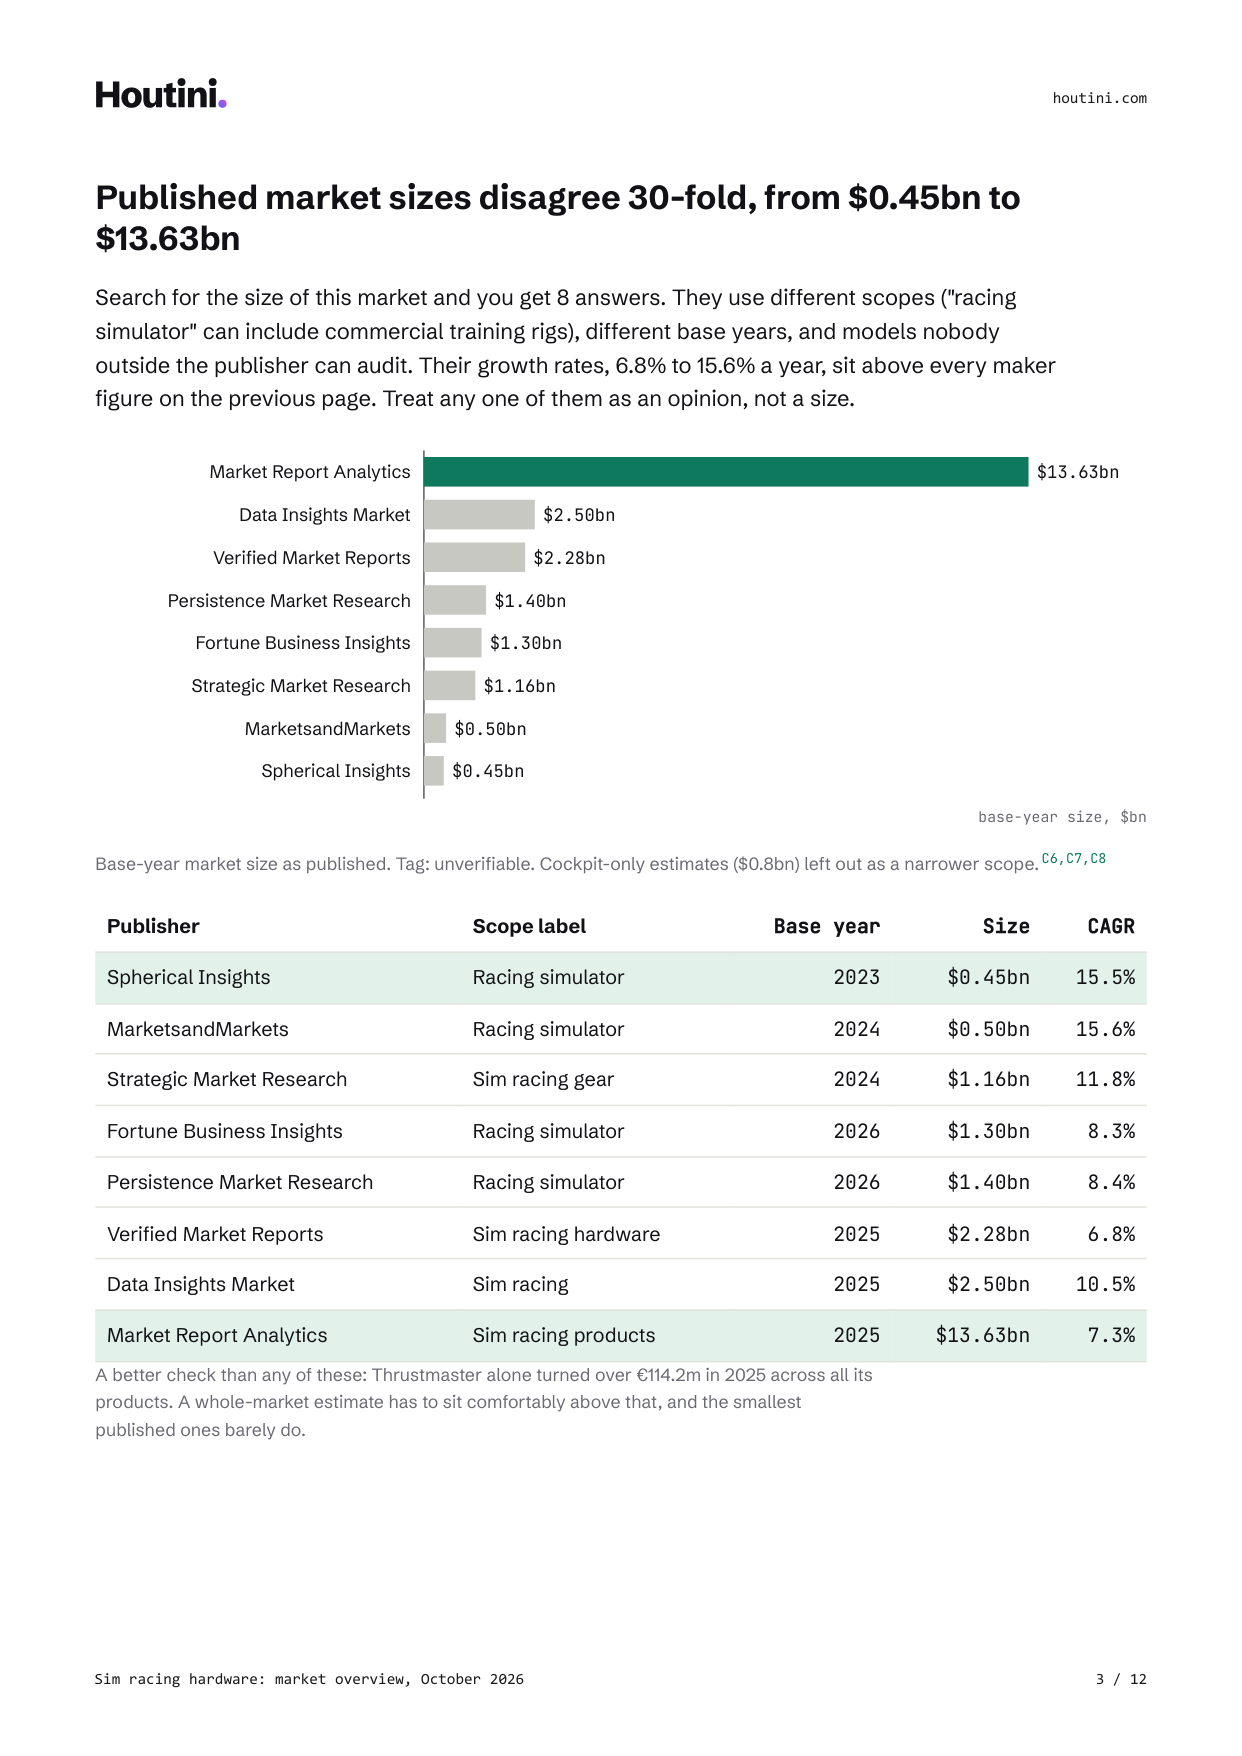
Then search for the published market sizes and put them side by side. Claude found eight reports with base-year sizes from $0.45bn to $13.63bn, a 30-fold gap. All of them are paywalled, and the scopes differ, since "racing simulator" can include commercial and training simulators. They model a CAGR (compound annual growth rate, the average yearly growth over the forecast) of 6.8% to 15.6%, and even the lowest sits above the -40% to +4% in the filings. Tag them all reported-unverifiable. The spread is the finding, and none of them is "the" market size.
Two of these publishers are among those named in Opinion.org's 2021 piece "Fake Market Research", which describes publishers pushing templated reports through press-release sites. Its test is that a specialist publisher has a few dozen reports, not thousands.
For a sanity check, hold them against the filings. Thrustmaster's turnover alone, across all its products, is about €114m, so a whole-market figure has to sit comfortably above that.
Add search data: demand, share of search and prices
Search data is the part you can measure yourself. SEO Audit Console pulls it from DataForSEO, and the run used five of its tools for demand and share, then a product catalogue for prices.
Five years of search interest
topic_trend returns Google Trends for up to five keywords. The Google Trends index is relative: 100 is the peak of the series and every other week is scaled against it, so it's not a count of searches. The run pulled the past five years for the US. If you'd rather query Trends directly, how to connect Google Trends to Claude Code walks through the setup.
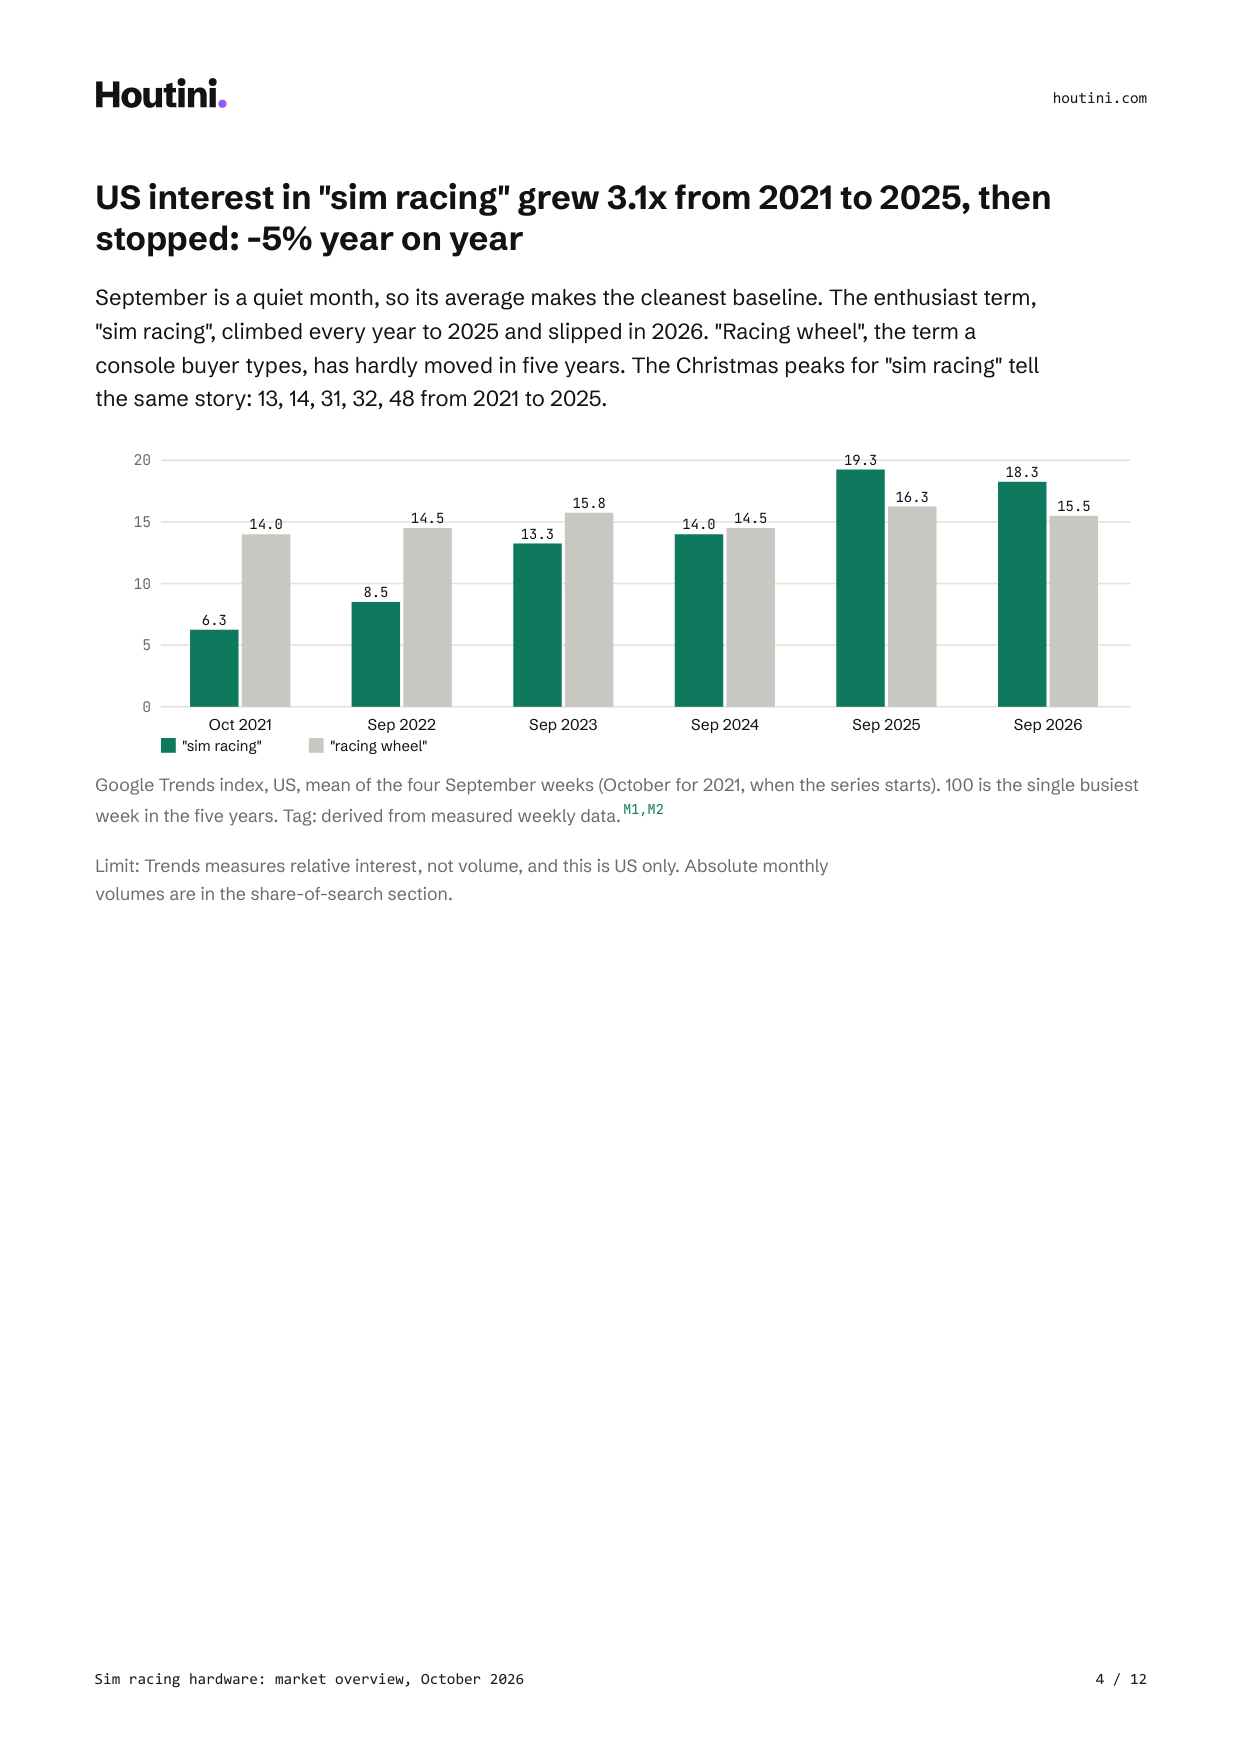
"sim racing" roughly tripled between October 2021, when the series starts, and September 2025, going from a monthly average of 6.25 to 19.25. September 2026 came in at 18.25, 5% lower. Google's own help says the index includes noise, most of all on terms with low search interest, so call that flat, not falling.
"racing wheel", the generic term console buyers use, held a September level of 14 to 16 for five years. Then in spring 2026 it spiked, hitting 100 in the week of 17 May. The timing lines up with the Mario Kart World wheels going on sale on 23 March and Forza Horizon 6 launching on 19 May.
Monthly volume and share of search
keyword_volume gives monthly searches from Google Ads' Keyword Planner. The US brand terms come out at fanatec 40,500, thrustmaster 33,100, logitech g923 22,200, moza racing 18,100, simagic 18,100 and simucube 8,100. "moza" on its own returns 60,500, but Moza also makes camera gimbals, so use "moza racing". These numbers are a demand proxy, not market share. Thrustmaster's term covers its joysticks and gamepads too, so it overstates wheel demand, and Logitech appears only through its G923 wheel.
competitors_domain on fanatec.com shows who shares the results pages: makers, big-box retailers like Best Buy and Micro Center, specialist retailers and review sites. My own simracingcockpit.gg tops the overlap, with 2,172 shared keywords.
market_sizing works out share of voice (each domain's slice of the estimated search traffic across a set of keywords). The headline share covers every keyword the five domains rank for, Thrustmaster's Xbox controller searches included, so the racing clusters are the ones to read. These are the four, as shares of the estimated clicks:
| Racing search cluster | US searches a month | Thrustmaster | Moza | Fanatec |
|---|---|---|---|---|
| racing sim | 125,810 | 55.6% | 26.4% | 13.4% |
| racing simulator | 97,650 | 58.7% | 32.3% | 7.6% |
| racing wheels | 43,120 | 44.9% | 44.9% | 8.5% |
| xbox steering wheel | 41,610 | 84.6% | 7.2% | 8.3% |
domain_visibility tracks each domain's traffic estimate month by month (ETV, DataForSEO's modelled visits from organic search), and I pulled two years of it. From September 2025 to September 2026, Fanatec's fell 33%, from 110,447 to 74,383, and Moza's rose 17%, from 105,292 to 122,906. Fanatec's estimate was below the same month a year earlier in all twelve months to September, so the fall isn't seasonal. Quote the traffic estimates and the number of keywords each domain has in the top three, and leave the total keyword counts out: DataForSEO's totals fell 84% for Fanatec and 97% for Moza from their peaks, almost all of the loss outside the top 20.
Prices from a product catalogue
For prices, I used a product catalogue: 28 direct-drive bases, in stock, in US dollars, starting at $299.
A direct-drive base is sold on its torque, so dividing price by newton-metres puts every model on one scale. Moza's median comes out at $33 per Nm and Fanatec's at $55. That's Glen Allsopp's per-unit pattern from his detailed.com studies: convert offers that are packaged differently into a single unit so they line up.
The catalogue was my own product-data pipeline, which serves pricing data to affiliates like simracingcockpit.gg. The price section covers direct-drive bases only, which leaves out gear-driven and belt-driven wheels like the G923 and the T300, and the report says so beside the figures.
Fact-check every figure before it goes in
Three checks run before anything reaches the PDF. A ledger records where each figure came from, a script re-checks the source, and a second model has to find each reported figure for itself.
Keep a claims ledger
A claims ledger is one file, claims.json, with a row for every figure the report uses. Each row has an id and a tag (measured, reported, reported-unverifiable or derived). A reported row adds the URL, an exact quote from that page and, where there is one, a second source. A measured or derived row names the tool pull or shows its working instead, and any row can carry a limit. The run ended with 19 rows. This is the row for Asetek:
{
 "id": "C14",
 "figure": "Asetek SimSports revenue $5.709m in 2025 vs $9.594m in 2024 (-40%); segment adjusted EBITDA -$8.5m",
 "tag": "reported",
 "url": "https://mb.cision.com/Public/6758/4332189/b0e080c383dfa1ab.pdf",
 "verify_url": "https://mb.cision.com/Public/6758/4332189/a3b61a579acb1aef.xhtml",
 "quote": "5,709",
 "limit": "Asetek 2025 Annual Report, segment note; release dated 8 Apr 2026"
}
The limit field is the human half of the check. A script can confirm the quote is on the page, but it can't tell you when the figure means something narrower than the report makes it sound. The quote behind Corsair's +4% is on the page, for example, but the figure covers a whole segment that includes Elgato, SCUF, keyboards and mice.
Re-check every source with a script
verify_claims.py fetches each URL in the ledger and looks for the quote. If a reported claim fails, it exits with code 1 and the run stops.
My first pass came back 12 of 15. Corsair's investor site and Business Wire blocked the scripted fetch or timed out, and Fortune Business Insights returned 403. For the Corsair rows, the fix was to check against TechPowerUp's verbatim republication, stored as verify_url, and keep the citation on Corsair's own release. Rows already tagged unverifiable warn instead of failing. Granite Devices' own site blocks scripted fetches too, so C16, which quotes its announcement, passes on the Firecrawl search logged in the row. The final pass was 19 of 19:
First pass:
C4   reported               UNREACHABLE: TimeoutError
C5   reported               UNREACHABLE: TimeoutError
C8   reported-unverifiable  UNREACHABLE: HTTPError
12/15 verified

After the fix:
C1   reported               OK
C2   reported               OK
C3   reported               OK
C4   reported               OK via mirror
C5   reported               OK via mirror
C6   reported-unverifiable  OK
C7   reported-unverifiable  OK
C8   reported-unverifiable  UNREACHABLE: HTTPError (warn: row already tagged unverifiable)
C9   reported               OK
C10  reported               OK
M1   derived                OK (tool pull named)
M2   measured               OK (tool pull named)
M3   measured               OK (tool pull named)
M4   measured               OK (tool pull named)
M5   measured               OK (tool pull named)
C14  reported               OK via mirror
C15  reported               OK
C16  reported               UNREACHABLE: HTTPError (passed: firecrawl_search 2026-10-06)
D1   derived                OK (tool pull named)

19/19 verified
Ask a second model to check the reported figures cold
The last check goes to Gemini through gemini_chat, with grounding switched on (the model searches Google as it answers). It gets the nine reported claims with one instruction: don't trust the claim text, find the figure yourself. It came back with 8 confirmed and 1 disputed.
The disputed claim was C12, that Simucube publishes no revenue. Gemini was right. Granite Devices Oy is Finnish, and Finnish company accounts are public. The accounts gave five years of Simucube's turnover, including a drop to €8.8m in 2022, and from there the run went on to find Asetek's segment data. This is the prompt I sent, and Gemini's reply on C12:
Fact-check each claim below independently using web search. For each, reply on one line:
ID | CONFIRMED / DISPUTED / CANNOT VERIFY | the source URL you used | one short reason.
Do not trust the claim text; find the figure yourself. Today is 6 October 2026.
...
C12: Moza Racing, Simagic and Simucube do not publish audited revenue figures.
C12 | DISPUTED | https://simucube.com | Simucube (Granite Devices Oy) is a Finnish company whose audited financials are publicly registered, and it actively publishes its revenue figures.Check the model's source, not its verdict. The EBU's research with the BBC on AI assistants found about a third of their answers had serious sourcing problems. Here, Gemini's URL was only simucube.com. Its reason held up, though, because the company's turnover is on the Finnish trade register, and two credit-bureau sites carry the figures. Grounded answers also cite Google redirect links rather than the page itself, so resolve those before anything goes into the ledger.
Grounding is billed per search the model runs, and one claim can trigger several. The first 5,000 searches a month are free across the Gemini 3.x models, and after that it's $14 per 1,000.
Build the PDF from the data files
The report format is modelled on Glen Allsopp's detailed.com studies. Every heading states the finding with its number, the dataset comes up front, the tag sits beside every figure, limits sit next to the number they affect, and there's a changelog.
build_report.py reads only the data files: the saved tool responses in raw/, the price table and claims.json. It runs two checks before it writes anything.
The transcription check recomputes the September baselines and Christmas peaks and asserts they match the run log. The first build failed on it: "racing wheel" had 261 weeks against 262 for "sim racing", because a week had been dropped when the trend data was copied by hand. The number check routes every number in the body through the data, so any number left in the visible text was typed by hand. It caught 14 of them: band labels, month strings and the Trends maximum.
First build:
AssertionError: 262
sense check, numbers not traced to a data file: ['100', '04', '05', '06', '07', '08', '09', '400', '400', '699', '700', '999', '1,000', '15']
FAIL: hand-typed numbers in the body

Final build:
sense check, numbers not traced to a data file: none
wrote final/report.html and research/report-data.json
The report came out at 12 pages after one review of every page, which fixed five faults, from colliding chart labels to a rounding error. I printed it with the house-style Skill from how to make a PDF report with Claude.
Re-run it every quarter with one prompt
There are three pieces that let the same run repeat each quarter: a config file, a saved prompt and a schedule.
Freeze the scope in a config file
market-config.json holds the trend keywords, the volume and brand terms, the lead domain and its rivals, the clusters to keep, the price source and the list of filings. Each quarter then asks the same questions of the same sources.
{
 "market": "sim racing hardware (wheels, wheelbases, pedals and cockpits)",
 "client_question": "whether to enter the market",
 "location": "United States",
 "trend_keywords": ["sim racing", "racing wheel", "direct drive wheel", "sim rig"],
 "volume_keywords": ["fanatec", "moza racing", "moza", "simucube", "logitech g923", "logitech g pro wheel", "thrustmaster", "thrustmaster t300", "asetek simsports", "simagic", "cammus", "sim racing", "sim racing wheel", "racing wheel", "direct drive wheel", "direct drive wheelbase", "sim racing cockpit", "sim rig", "racing sim", "sim racing pedals", "load cell pedals", "best sim racing wheel", "sim racing setup", "trak racer", "playseat", "next level racing"],
 "brand_terms": ["fanatec", "thrustmaster", "logitech g923", "moza racing", "simagic", "simucube", "cammus", "asetek simsports"],
 "lead_domain": "fanatec.com",
 "compare_domains": ["mozaracing.com", "simagic.com", "simucube.com", "thrustmaster.com"],
 "market_clusters_keep": ["racing sim", "racing simulator", "racing wheels", "xbox steering wheel"],
 "price_catalogue": {"tool": "simracing-affiliate search_simracing_products", "category": "wheelbase", "availability": "In Stock", "currency": "USD"},
 "filings": [
  {"company": "Guillemot Corporation", "brand": "Thrustmaster", "where": "annual results release, Thrustmaster turnover line"},
  {"company": "Corsair Gaming", "brand": "Fanatec", "where": "Q4/FY results release, Gamer and Creator Peripherals segment"},
  {"company": "Asetek A/S", "brand": "Asetek SimSports", "where": "annual report segment note, SimSports revenue"},
  {"company": "Granite Devices Oy", "brand": "Simucube", "where": "Finnish trade register via asiakastieto.fi, turnover by year"}
 ],
 "disclosure": "The author owns simracingcockpit.gg, a sim racing review site that appears in the competitor data."
}
Run the saved prompt headless
The saved prompt walks Claude through nine steps: desk research, demand, share of search, prices, the claims ledger, the script check, the second opinion, the report build and a comparison with last quarter. It also tells Claude to save every tool response to raw/ before using it, and never to type a number into a file by hand.
Research the market set out in market-config.json and build the report. Work in this folder. Save every tool response you use to raw/ as JSON before you use it, and never type a number into a file by hand.

The two scripts read raw/topic_trend.json, raw/search_data.json, raw/filings.json, raw/run-costs.json (the cost each metered call reported), price-bands.json and claims.json. ../previous/ holds last quarter's copy of each: match those formats exactly.

1. Desk research. Search the web for each company in "filings" and open the primary source: the results release, the annual report or the trade-register page. Note the exact line, the figure, the URL and a short exact quote. Search for published market-size reports and record each publisher, scope, base-year size and growth rate. Run news_discovery on the market's main term for the last 90 days.
2. Demand. Run topic_trend (past 5 years) on "trend_keywords" and keyword_volume on "volume_keywords", for "location". Save both to raw/.
3. Share of search. Run competitors_domain on "lead_domain", then market_sizing with "compare_domains", then domain_visibility on the lead domain and the strongest rival. In market_sizing, read the clusters in "market_clusters_keep"; the headline share covers every keyword the domains rank for, and the clusters are the market view. From domain_visibility, quote traffic estimates and top-3 counts only, never total keyword counts.
4. Prices. Pull current prices from "price_catalogue". Keep new, in-stock units in one currency, and work out price per unit of the main spec.
5. Claims ledger. Add every figure you will use to claims.json: id, the figure, a tag (measured, reported, reported-unverifiable or derived), the URL, an exact quote that appears on that page, a second source where one exists, and the limit that applies to it. Never cite a search snippet; open the page.
6. Check. Run python verify_claims.py. If a reported claim fails, fix the claim or its source, never the script, and run it again until it passes.
7. Second opinion. Send the reported claims to gemini_chat with search grounding and ask it to find each figure itself and say CONFIRMED, DISPUTED or CANNOT VERIFY, with its source. Chase every DISPUTED to a primary source, update claims.json, and run step 6 again.
8. Report. Run python build_report.py. If its sense check fails, fix the data or the template, then look at every page of the PDF before you finish.
9. Compare. If last quarter's report-data.json exists in ../previous/, list every headline figure that changed, with both values, in changes.md. Google Trends rescales every pull to its own peak, so compare search interest as ratios within each pull, never point against point across pulls.

Finish with a short note: what changed since last quarter, which claims needed chasing, and anything you could not verify.
To run it unattended, use headless mode (claude -p, Claude Code with no one at the keyboard). I ran the test in a fresh folder, with last run's files in previous/ standing in for last quarter, on Sonnet with a $15 budget cap. It took about 39 minutes, 138 turns and 137 tool calls, exited with "success", and cost $14.24. That figure is the model alone. DataForSEO added about $0.11, because several calls were served from the cache of the first run, and even uncached the first run's search data cost $0.37.
It produced a 13-page PDF with the same headline findings. verify_claims.py passed all 20 of its claims, and the number check came back clean. It found three analyst reports to the first run's eight. Gemini disputed the Mario Kart World wheel date, because one outlet said 26 March against five saying 23 March. It kept 23 March and logged the dispute in the claim's limit field.
Step 9 failed. previous/ sat outside the folders a headless session may read, so the comparison wasn't written. Nine tool calls were denied in all: three on previous/, four to the built-in WebSearch, which wasn't on the allow-list, and two cp commands. The command below adds --add-dir ../previous and allows WebSearch. It leaves out my own catalogue server, so name your price source in the config's price_catalogue and add its tool to --allowedTools.
claude -p "$(cat market-research.prompt.md)" --model sonnet --max-budget-usd 15 --add-dir ../previous --permission-mode acceptEdits --allowedTools "Bash(python:*)" "WebSearch" "WebFetch" "mcp__seo-audit-console" "mcp__firecrawl" "mcp__gemini" --output-format stream-json --verbose > run.jsonl"subtype": "success", "num_turns": 138, "duration_ms": 2353334, "total_cost_usd": 14.24Read the run's final note, because it says what it couldn't do. The exit status says "success" either way.
Put it on a schedule
Use a local Desktop scheduled task. Cloud routines can't see MCP servers added with claude mcp add, because those are stored on your machine.
A local task means the computer has to be awake and the app open on the day. Quarterly isn't one of the presets, so ask Claude in a session to set a custom schedule. If the machine sleeps through a run, Desktop runs the most recent missed one when it wakes, as long as that's within 7 days. This is the instruction to give it:
Create a scheduled task called quarterly-market-report.
Schedule (cron, local time): 0 9 10 2,5,8,11 *   - 9am on the 10th of February, May, August and November
Working folder: the folder holding market-config.json and the two scripts
Prompt: the full text of market-research.prompt.md
I haven't created the scheduled task yet. I started the headless test by hand, and I haven't re-run it since making the changes above.
Gotchas
Four of these came up in my runs and two come from the docs, and I'm sharing them so you don't hit them yourself.
A search snippet carries the wrong number
Brave's search snippet for Granite Devices' Vainu page said "11,4 milj". The page itself says €15.5m. Never cite a snippet. Open the page and take the quote from there.
Investor sites block scripted fetches
Corsair's investor site, Business Wire and Fortune Business Insights all refused the script in my run, and the re-check step above shows how each one was handled. Firecrawl also charges for 403 and 404 pages that come back as a document, so check the status code and not only whether content came back.
Numbers copied by hand drift
My hand copy of the trend data lost a week, and the build's transcription check caught it. Save the raw tool output to files and build from those.
A headless run can succeed without its tools
If an MCP server fails to load, claude -p skips it and exits cleanly. Read mcp_server_errors in the init event, a field that arrived in Claude Code 2.1.219, and fail the job when it lists a server, so a run with a missing data server doesn't pass.
Search interest rescales on every pull
Each Trends pull is scaled to its own peak, so an 18 this quarter and an 18 next quarter may not mean the same thing. Re-pull the whole window each quarter, keep the same keywords, and compare ratios between terms rather than appending new weeks to old ones.
Large tool results land in a file
Claude Code saves any tool result over 50,000 characters to a file. In the headless test, Claude then tried to copy a large catalogue result with cp, but Bash was allowed only for Python, so the call was denied and it paginated the catalogue in small pages instead. Asking the tool for fewer rows per call keeps each result inline.
Where to go from here
Copy the config file, swap in your market's keywords, domains, companies and price source, and paste the brief into Claude Code. The first run is the slow one, because that's when you find out which filings exist and which investor sites block scripts.
To turn the same data files into a deck, how to make a presentation with Claude picks up where the PDF leaves off. For more on the second-model check, read AI fact-checking agents.
Continue reading.
- How-to Guidesn8n MCP: How to Connect Claude Code to n8n and Use Its API Safely
- How-to GuidesHow to Run Qwen3-Coder-Next Locally: My vLLM Settings for Two 48GB RTX 4090s
- How-to GuidesHow to Build a Competitor Price Monitoring Pipeline with n8n
- How-to GuidesOpenCode vs Claude Code: Setting Up OpenCode Desktop on Windows
- How-to GuidesHow to Connect Google Trends to Claude Code
- How-to GuidesCLAUDE.md: How to Write One That Stays Lean