How to Make a PDF Report with Claude
In today's post I'm showing how I make a monthly PDF report in Claude from a CSV, and why I think it's a perfectly legitimate way to report, provided Claude checks every number against the file. A house-style Skill sets the look, and the outline is agreed before anything is built.
 Richard Baxter AI Ops & Marketing Engineer
 On this page
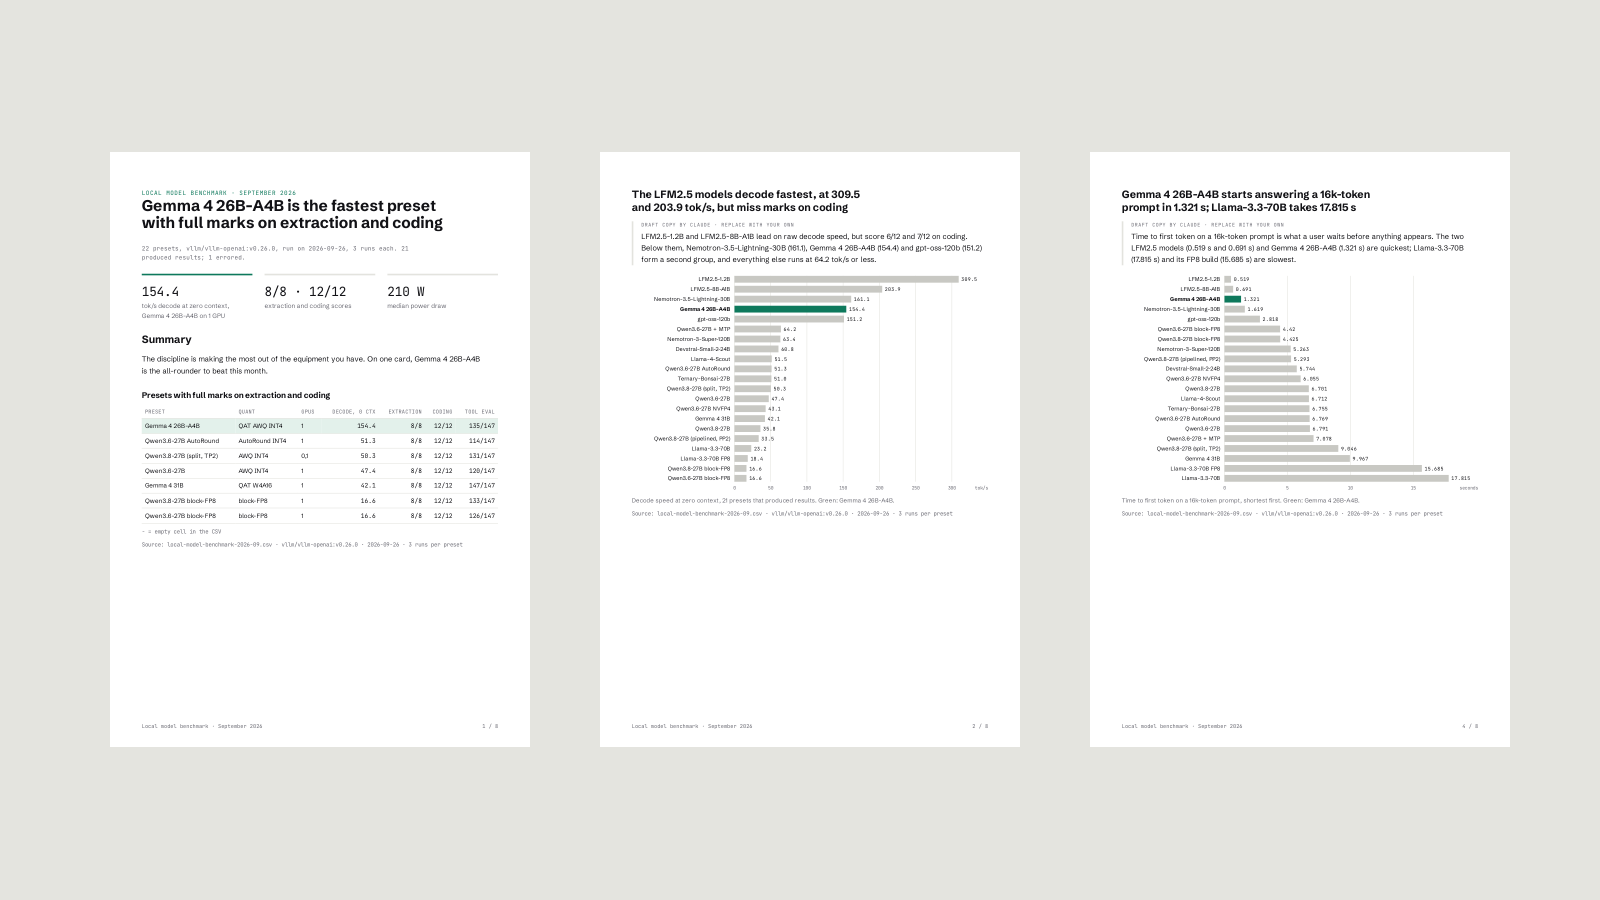
Most of us have a report that comes round every month. It might be a performance report, a finance pack or a client update, and the time goes on building it rather than reading it. So, can Claude build it for you? Yes, provided the numbers come from a file like a CSV or an API export rather than from the model, and there's a sense check where Claude tests its own work against that file.
Today I'm walking through how I do it in the Claude chat app, from switching the feature on to downloading a finished PDF report and the files to rebuild it next month. My worked example is an 8-page A4 report of my September local-model benchmark, made in claude.ai from the published results CSV. You'll need a Claude account with file creation switched on, which Anthropic lists on every plan, Free included. You won't need to write any code.
Quick Navigation
How to make a PDF (the quick answer) |
Before you start: switch on file creation |
Give Claude your house style with a Skill |
Make the report, step by step |
What you get back |
Next month: the same report with new numbers |
Where it goes wrong |
Where to go from here
How to make a PDF (the quick answer)
If you already have the document and just need it as a PDF, your computer can do that without any help:
- Windows: File > Print, choose Microsoft Print to PDF as the printer, then pick a folder and a file name.
- Word: File > Save a Copy (or Save As) > Browse, choose PDF from the list and Save.
- Mac: File > Print, open the PDF pop-up menu and choose Save as PDF.
- Google Docs: File > Download > PDF.
A report built from data is a different job. You want the charts, the tables and the words made for you, and every number traceable back to the source.
Before you start: switch on file creation
File creation is Claude running code on its own server to make real PDF, Word, Excel and PowerPoint files rather than just describing them in the chat.
Head to Settings > Capabilities and switch on "Cloud code execution and file creation". On my account that was off, and "Artifacts" was too, so I switched both on. The description under the file creation switch ends with "Required for skills", which means the Skill in the next step won't work without it.
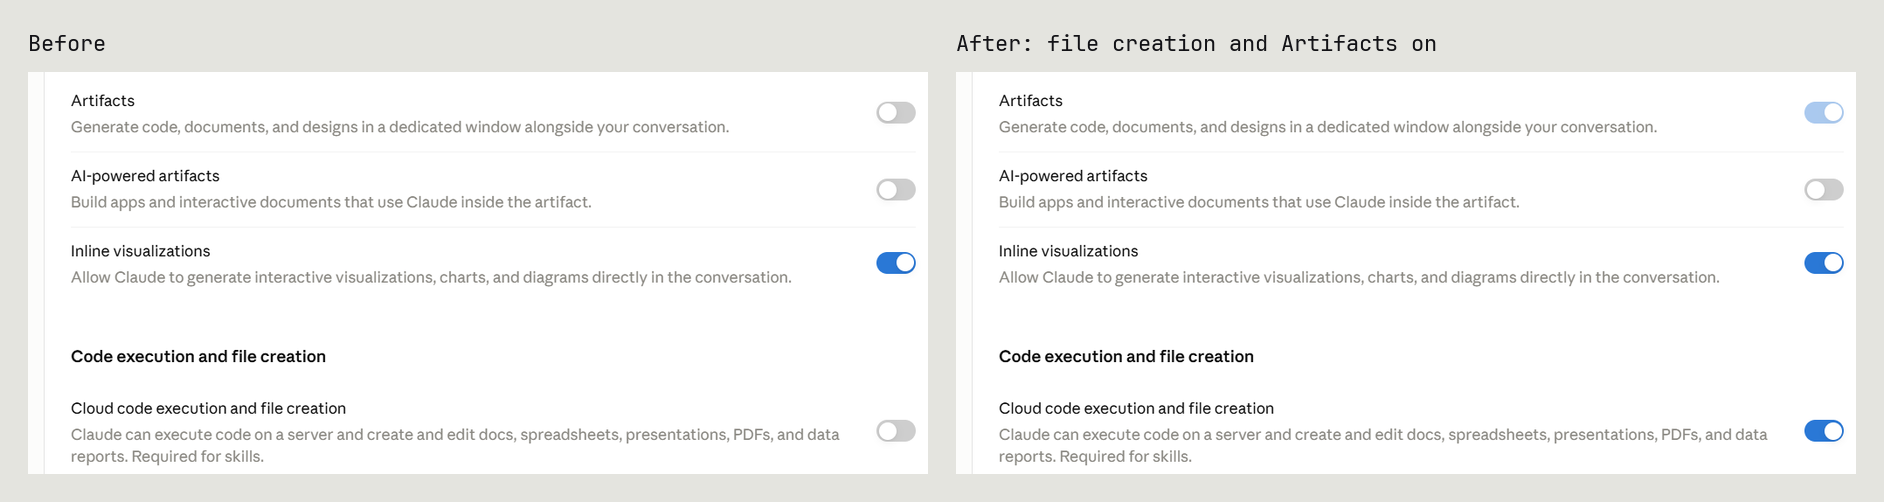
On Team and Enterprise plans it's an admin setting, under Organization settings > Capabilities, so if you can't see the switch, ask whoever runs your account. If you're signing up to Claude for this, new accounts get a free week of Claude Code.
Give Claude your house style with a Skill
A Skill is a folder of instructions and files that Claude loads when a task calls for it. I'd use one for your report's house style, because it keeps the mechanics of building the report apart from the design. Your prompt says what the report is about, and the Skill says what it looks like and the rules for making it.
Upload the Skill
Go to Settings > Customize > Skills. Mine showed the skills I'd made and the ones from Anthropic and partners. Click + Add > Upload skill. The upload page takes a .zip or .skill file with a SKILL.md inside, or a single .md file that opens with the skill's name and description in YAML, which just means a "name:" line and a "description:" line. It also says a security scan runs when you upload.
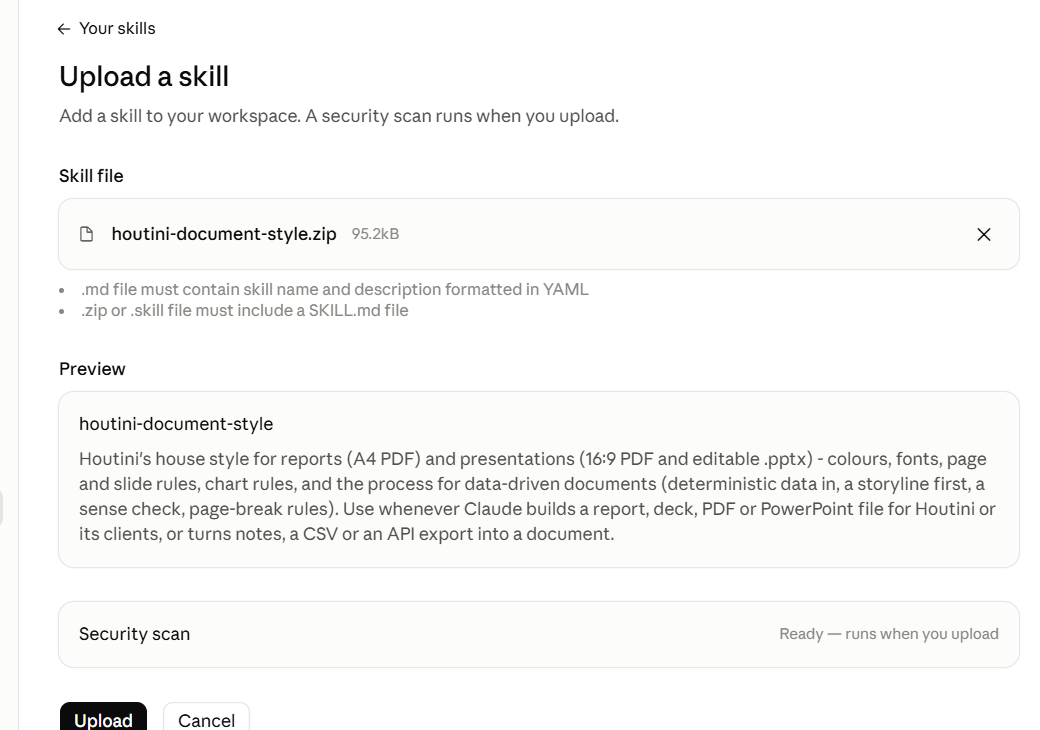
I chose houtini-document-style.zip, which is Houtini's own Skill. The page showed the name and description from its SKILL.md before I confirmed, and once it was uploaded it listed as "by you", v1, switched on. Yours can be a single SKILL.md with a name, a description and your rules. If it points to template files, put them in a folder with the same name as the skill, alongside the SKILL.md, and zip the folder. Skills are on every plan, and Anthropic ships built-in PDF, Word, Excel and PowerPoint skills that Claude uses by itself when they're relevant.
What goes in it
My Skill holds two kinds of thing. The first is the look: colours, fonts, one accent colour, and the page rules. Each main section starts on a new page, no heading is left stranded at the foot of a page, and tables and charts never split across two pages.
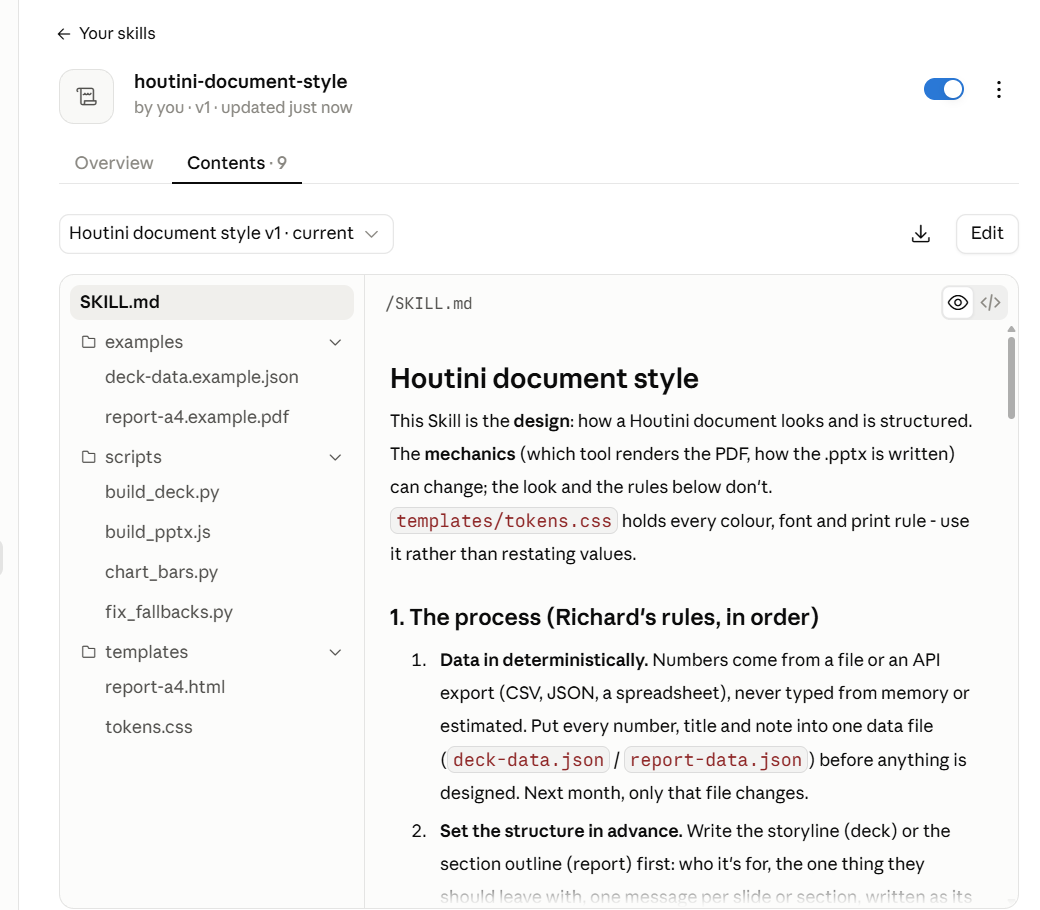
The second is the process: numbers come from the file, the outline is agreed first, the work gets checked, you review it in the preview and give feedback, last month's report is the template, and the narrative belongs to the author. This month's words and numbers stay out of the Skill, because they change every month.
I use the same house style for decks, and there's more on that in how to make a presentation with Claude.
Make the report, step by step
With file creation on and the Skill uploaded, the report itself took one chat.
Start from the data file
Start a new chat and click + > Add files or photos (or Ctrl+U), then pick your CSV. A CSV is a plain spreadsheet file, one row per line, which almost every tool can export. Mine had 22 rows, one per model setup, from the benchmark I've already published.
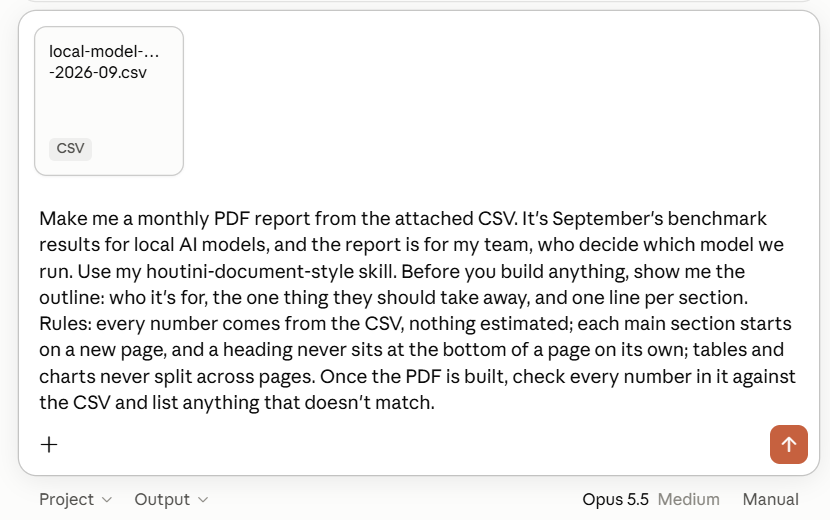
Why a file? In my view, reporting with AI is perfectly legitimate provided the data sources are provided in a deterministic way - from a CSV, an API and so on. Claude reads the numbers; it doesn't type them from memory. Here's the prompt I sent with it:
Make me a monthly PDF report from the attached CSV. It's September's benchmark results for local AI models, and the report is for my team, who decide which model we run. Use my houtini-document-style skill. Before you build anything, show me the outline: who it's for, the one thing they should take away, and one line per section. Rules: every number comes from the CSV, nothing estimated; each main section starts on a new page, and a heading never sits at the bottom of a page on its own; tables and charts never split across pages. Once the PDF is built, check every number in it against the CSV and list anything that doesn't match.Ask for the outline first
An outline is the plan of the report before any of it gets made: the sections, what each one says, and who it's for. Claude read the CSV and replied within a minute or two with "Here's the outline. Nothing is built yet."
It named who the report was for and the one takeaway: Gemma 4 26B-A4B is the fastest model setup with full marks on both extraction and coding, 8/8 and 12/12. It runs at 154.4 tokens per second (tok/s) on one GPU, drawing 210W. Then it listed seven sections, each titled with its message rather than a label.
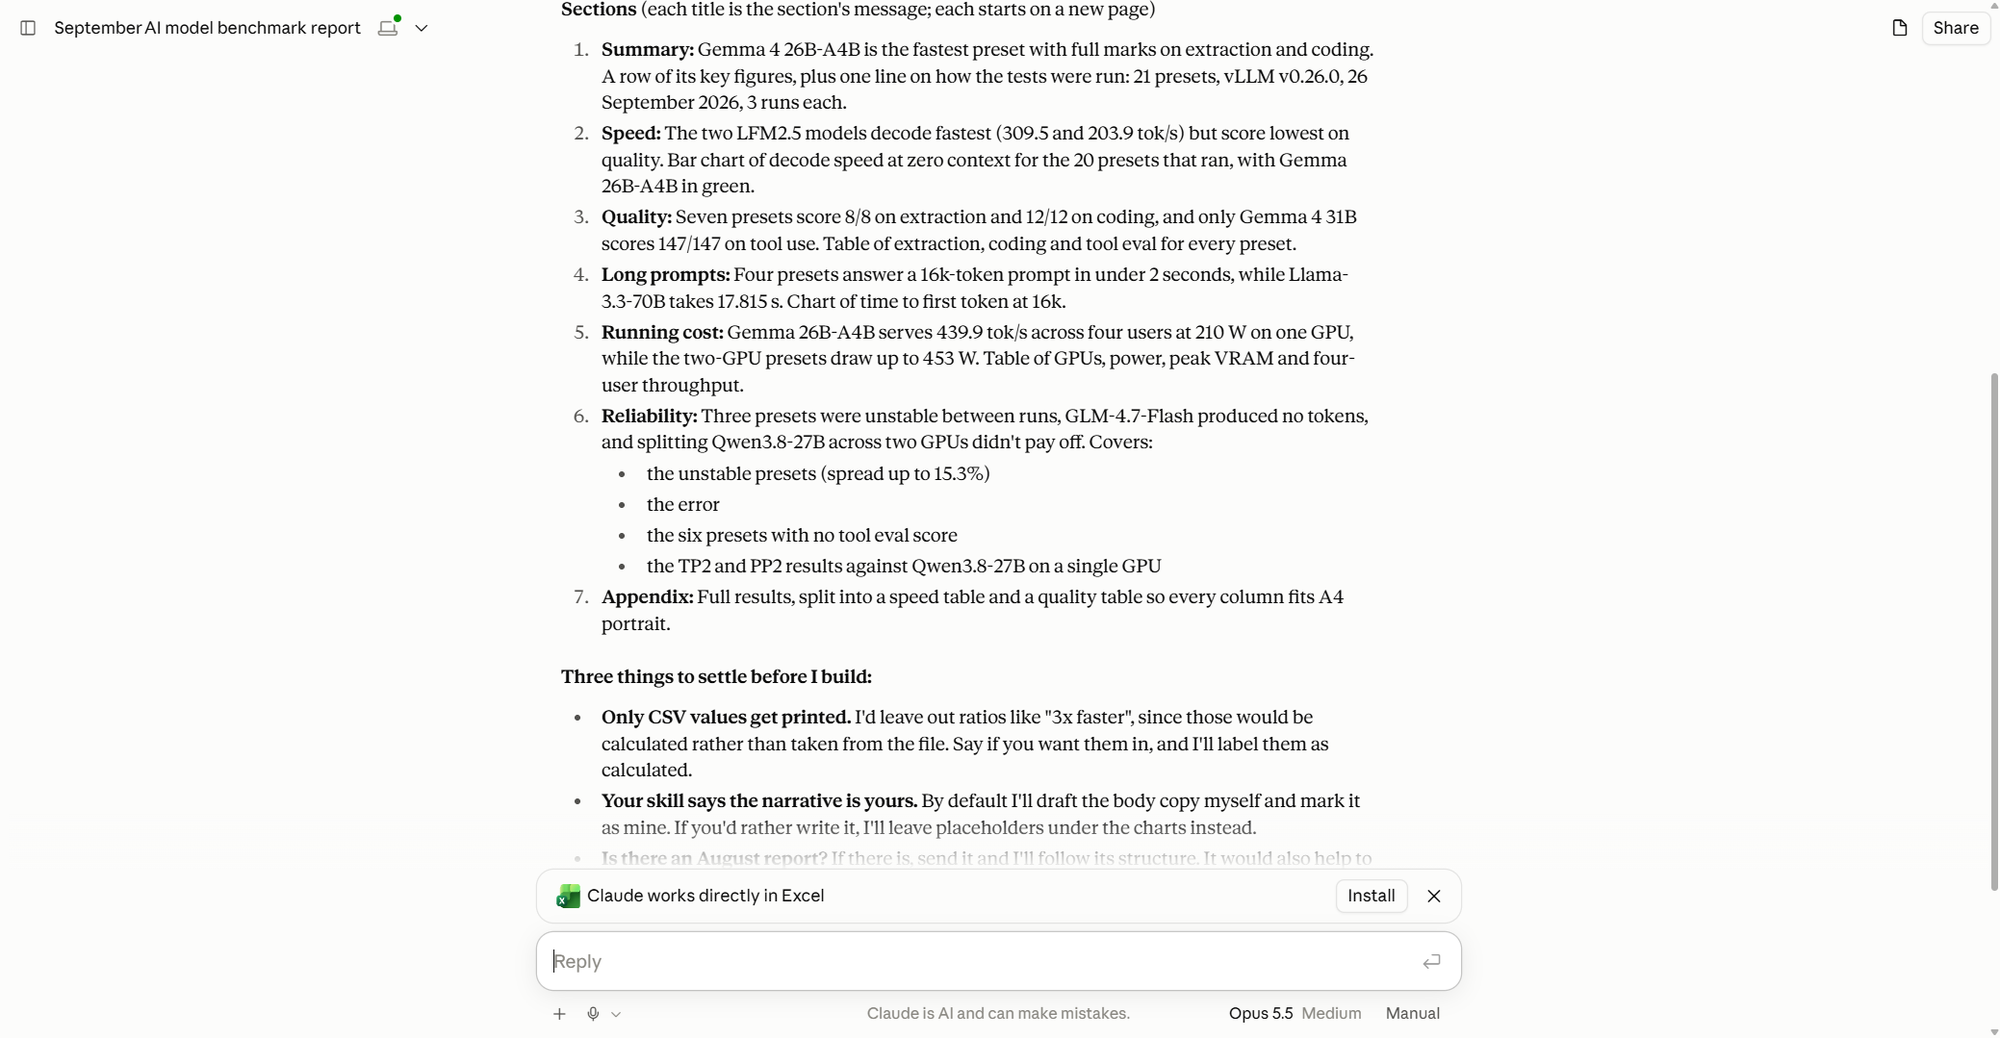
It also listed three things to settle before it built anything. Should calculated ratios like "3x faster" be left out unless labelled? My Skill says the narrative is mine, so it offered to draft the body copy and mark it as its own. And was there an August report whose structure it should follow? I approved the outline, said no ratios, and told it to draft and mark the copy, since I'd replace it. There was no August report, so I asked it to build this one for next month to follow, and to show me the pages as images before the final PDF.
Let it build, then check every number
A progress panel showed four steps: build a data file from the CSV, build the charts and report from that data file, render the PDF with page images, and check every number in the PDF against the CSV. Below it, "Used in this session" listed the CSV and houtini-document-style.
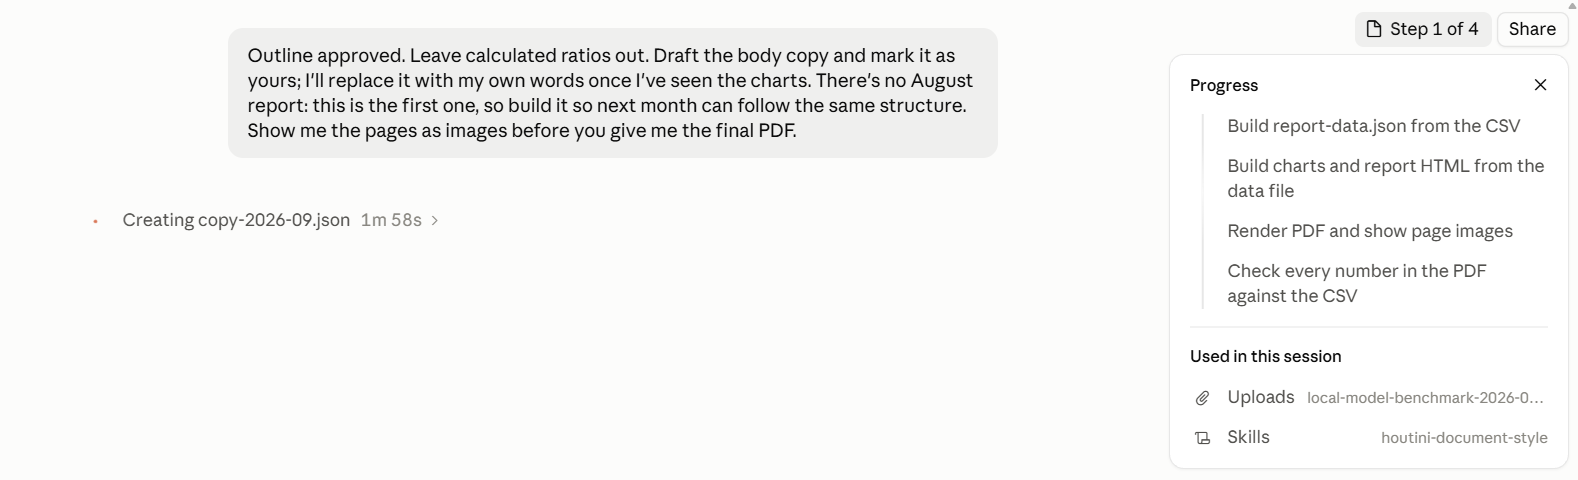
About five minutes later I had eight pages back as images, with the PDF held back until I'd looked at them. Then came the number check: "All 642 table cells match their row and column in the CSV." Every value in the text matched too, and both charts were drawn to scale. To test the check itself, it changed one value in a copy of the CSV, and the check caught it.
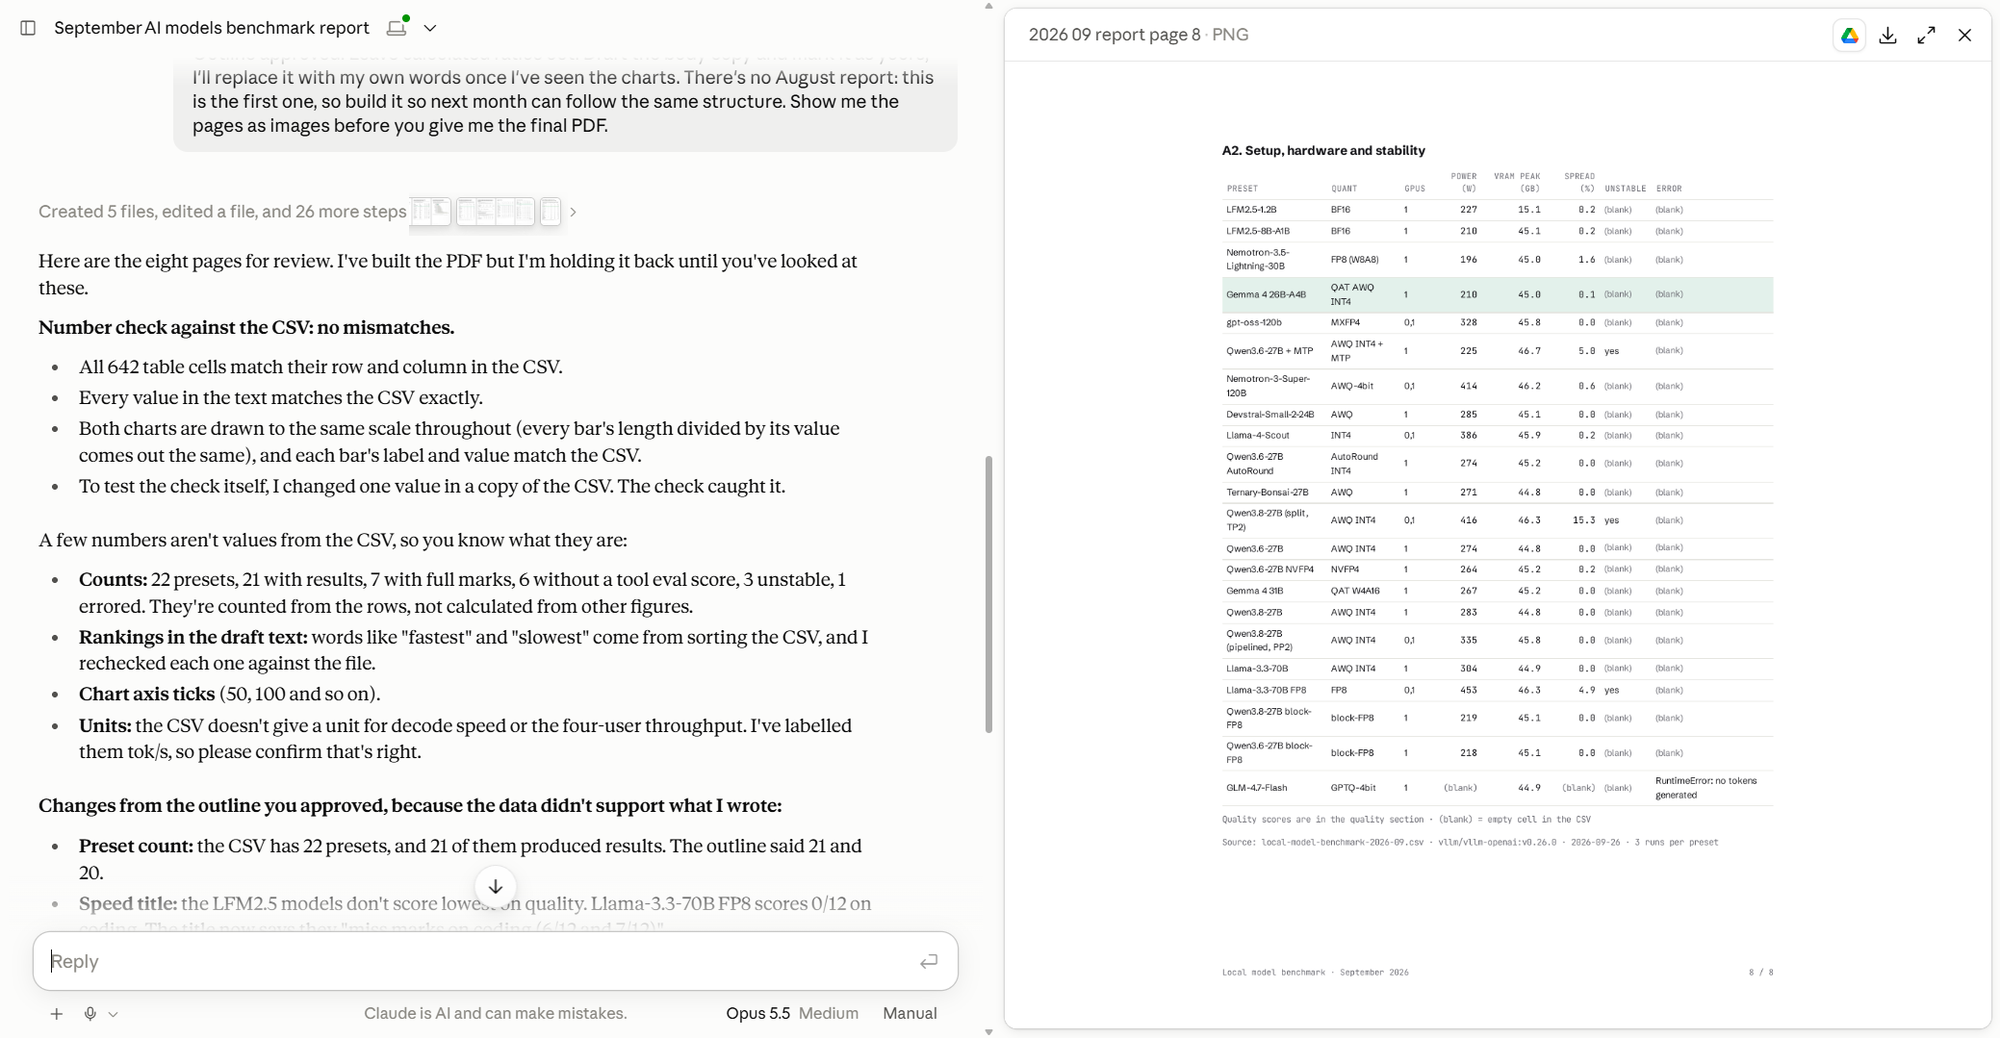
It had also changed its own outline where the data didn't support what it had written. There were 22 model setups, not 21, and a claim about "under 2 seconds" was dropped because that cut-off isn't in the CSV. That's the sense check I mean: a process where the model evaluates its own work.
Give feedback in the preview
Click a page image and it opens in the preview pane, the panel beside the chat where Claude shows what it has made. It's important to work with the output in the preview pane and give development feedback.
On the first build, the setup table on page 8 printed empty cells as "(blank)". Here's the feedback I sent:
Two changes. Show empty cells as a hyphen instead of "(blank)", and say so in the note under each table. Then replace your draft summary with my words: "The discipline is making the most out of the equipment you have. On one card, Gemma 4 26B-A4B is the all-rounder to beat this month." Keep everything else as it is, rebuild, run the number check again and give me the final PDF.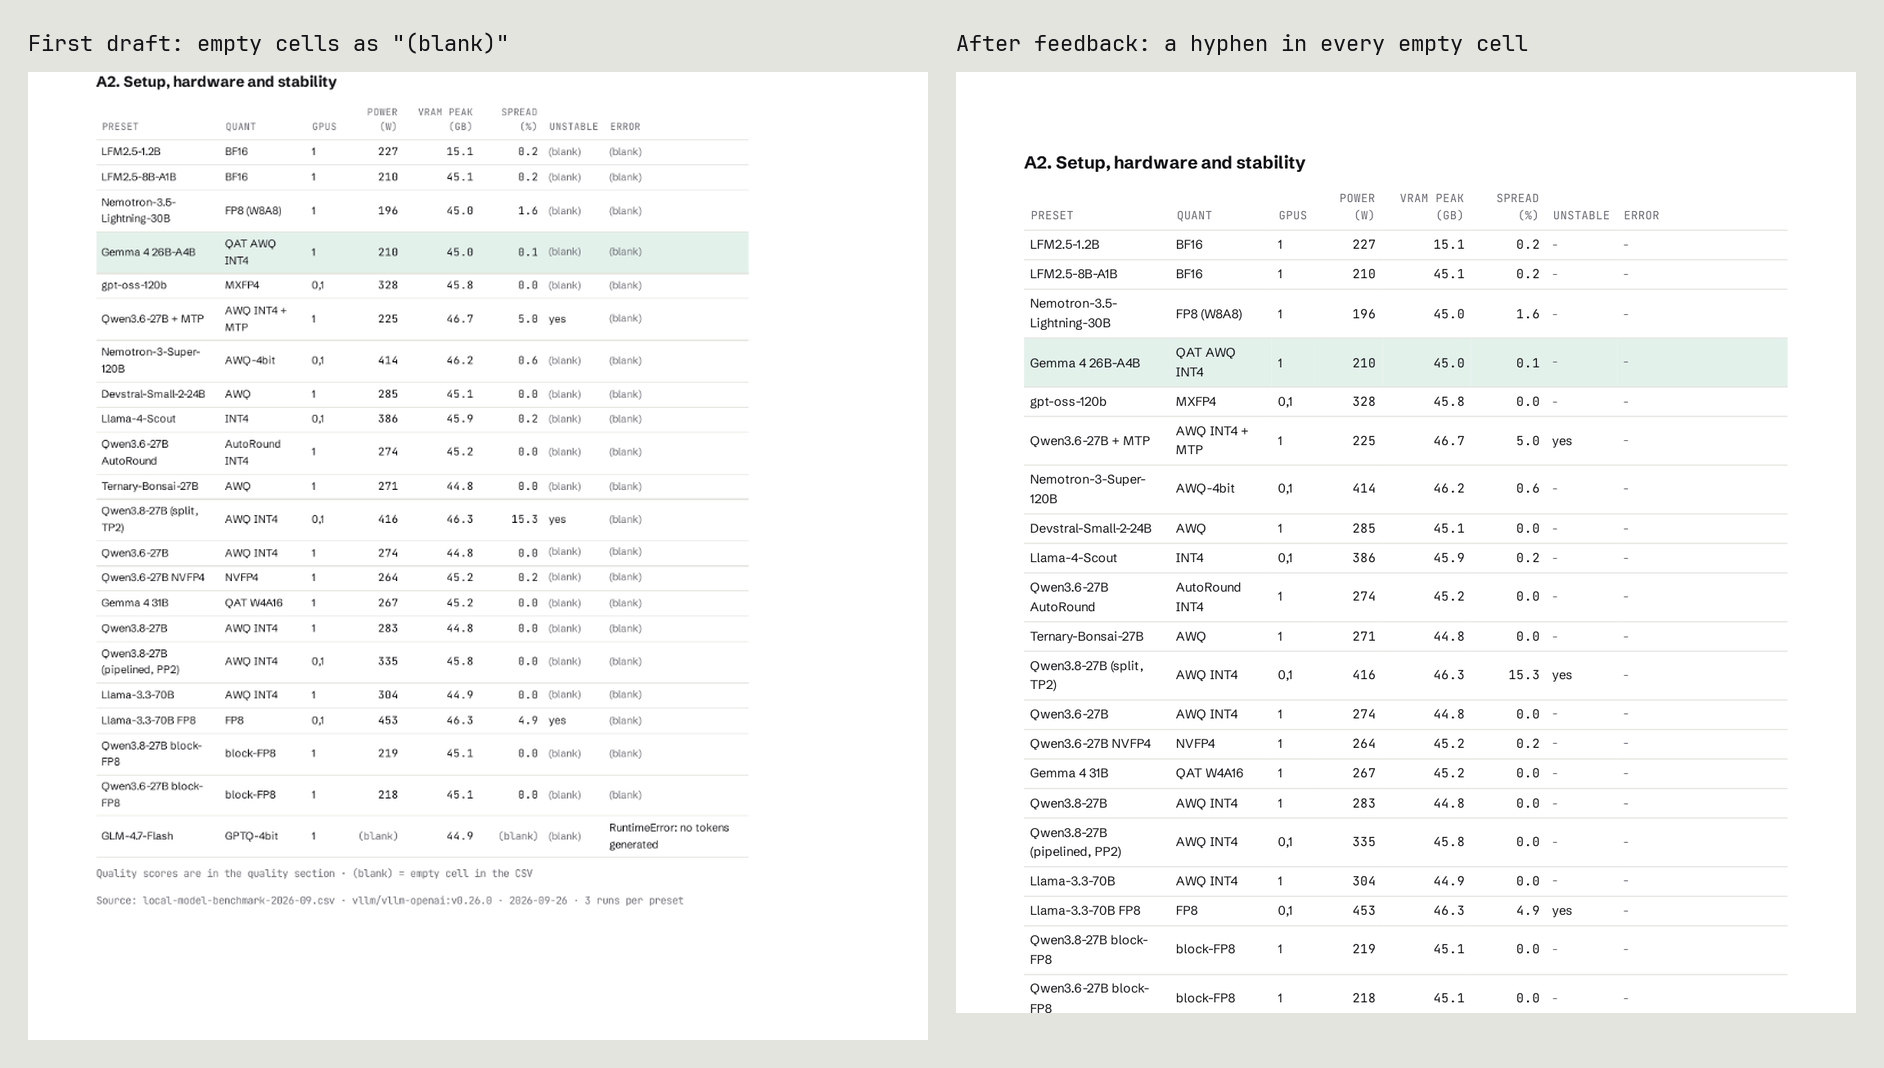
Claude rebuilt the report and ran the number check again: "Nothing in the PDF disagrees with the CSV." Every empty cell became a hyphen, with a note under all eight tables.
Put the narrative in your own words
As I'd asked, Claude marked its own wording as draft copy. On the first build the summary carried the tag "DRAFT COPY BY CLAUDE · REPLACE WITH YOUR OWN".
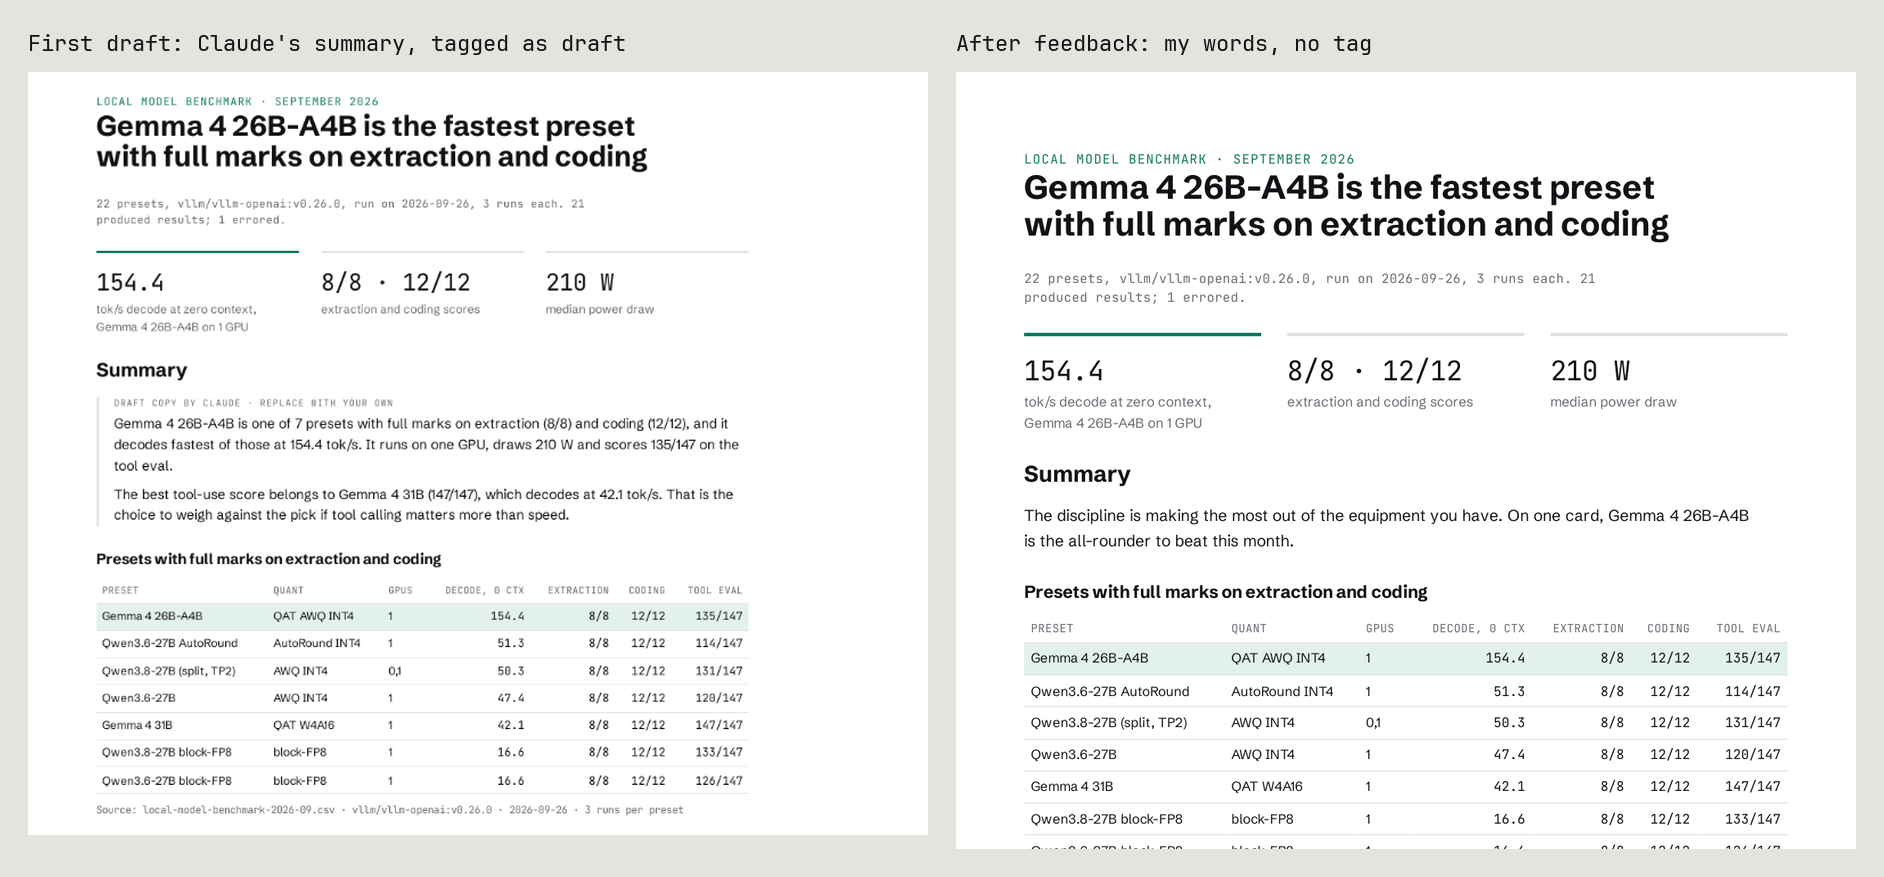
I recommend you dictate the narrative - once the charts and data are created, dictating the body copy pays dividends. In the same feedback message I swapped the summary for two sentences of mine, and Claude put them in exactly as written, without the draft tag. The paragraphs on pages 2 to 6 still carried it, and those are mine to dictate.
What you get back
Two file cards appeared in the chat: the PDF and a build zip, with a "Download all" button. When I clicked it, Chrome asked whether to allow claude.ai to download multiple files. If your browser asks the same, allow it for claude.ai.
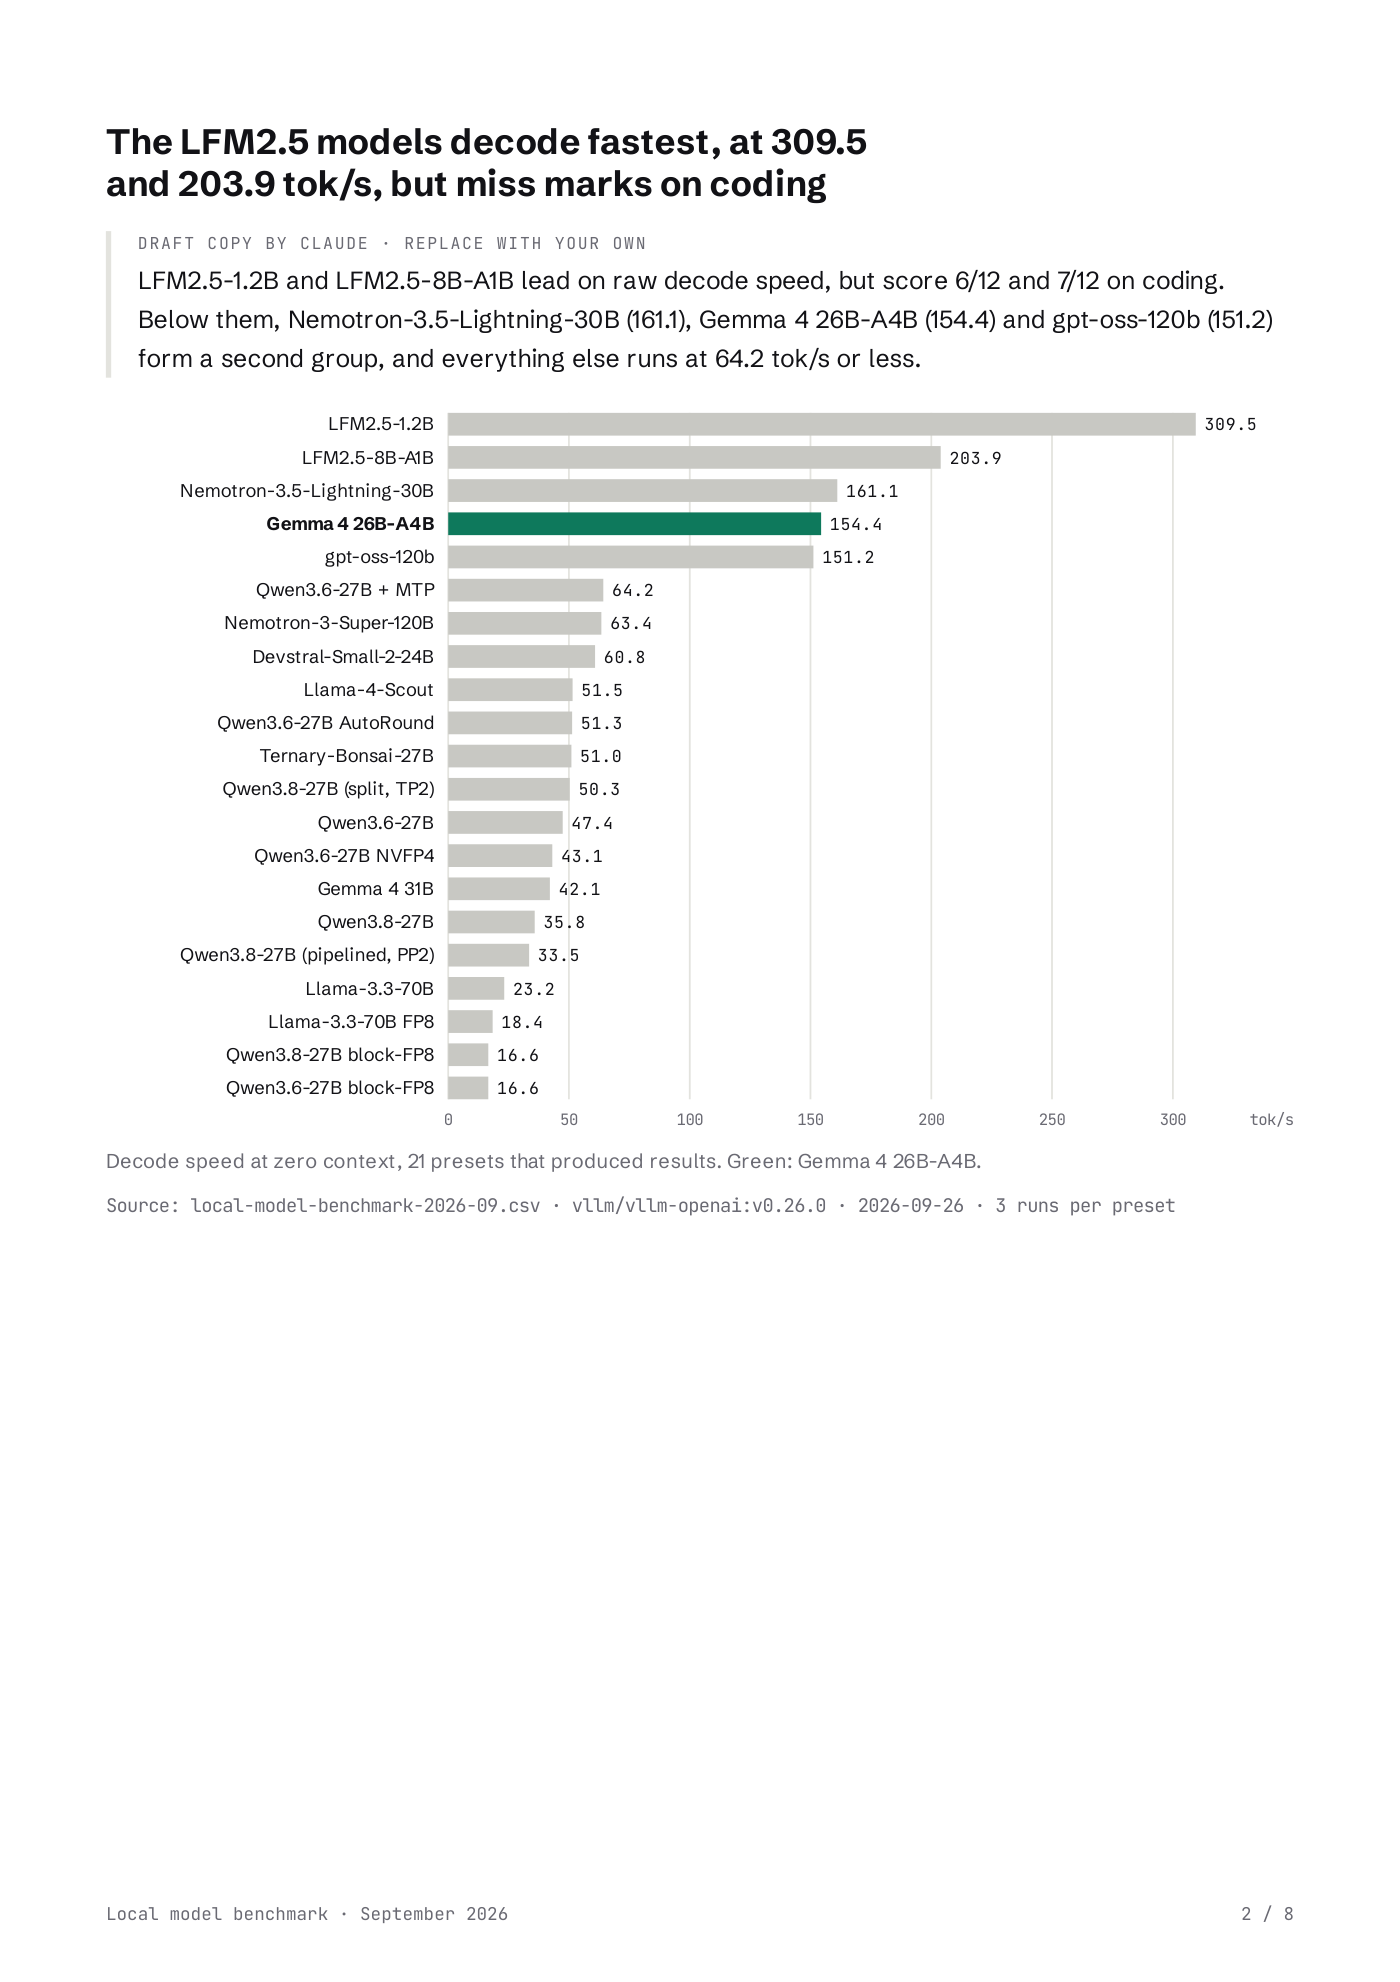
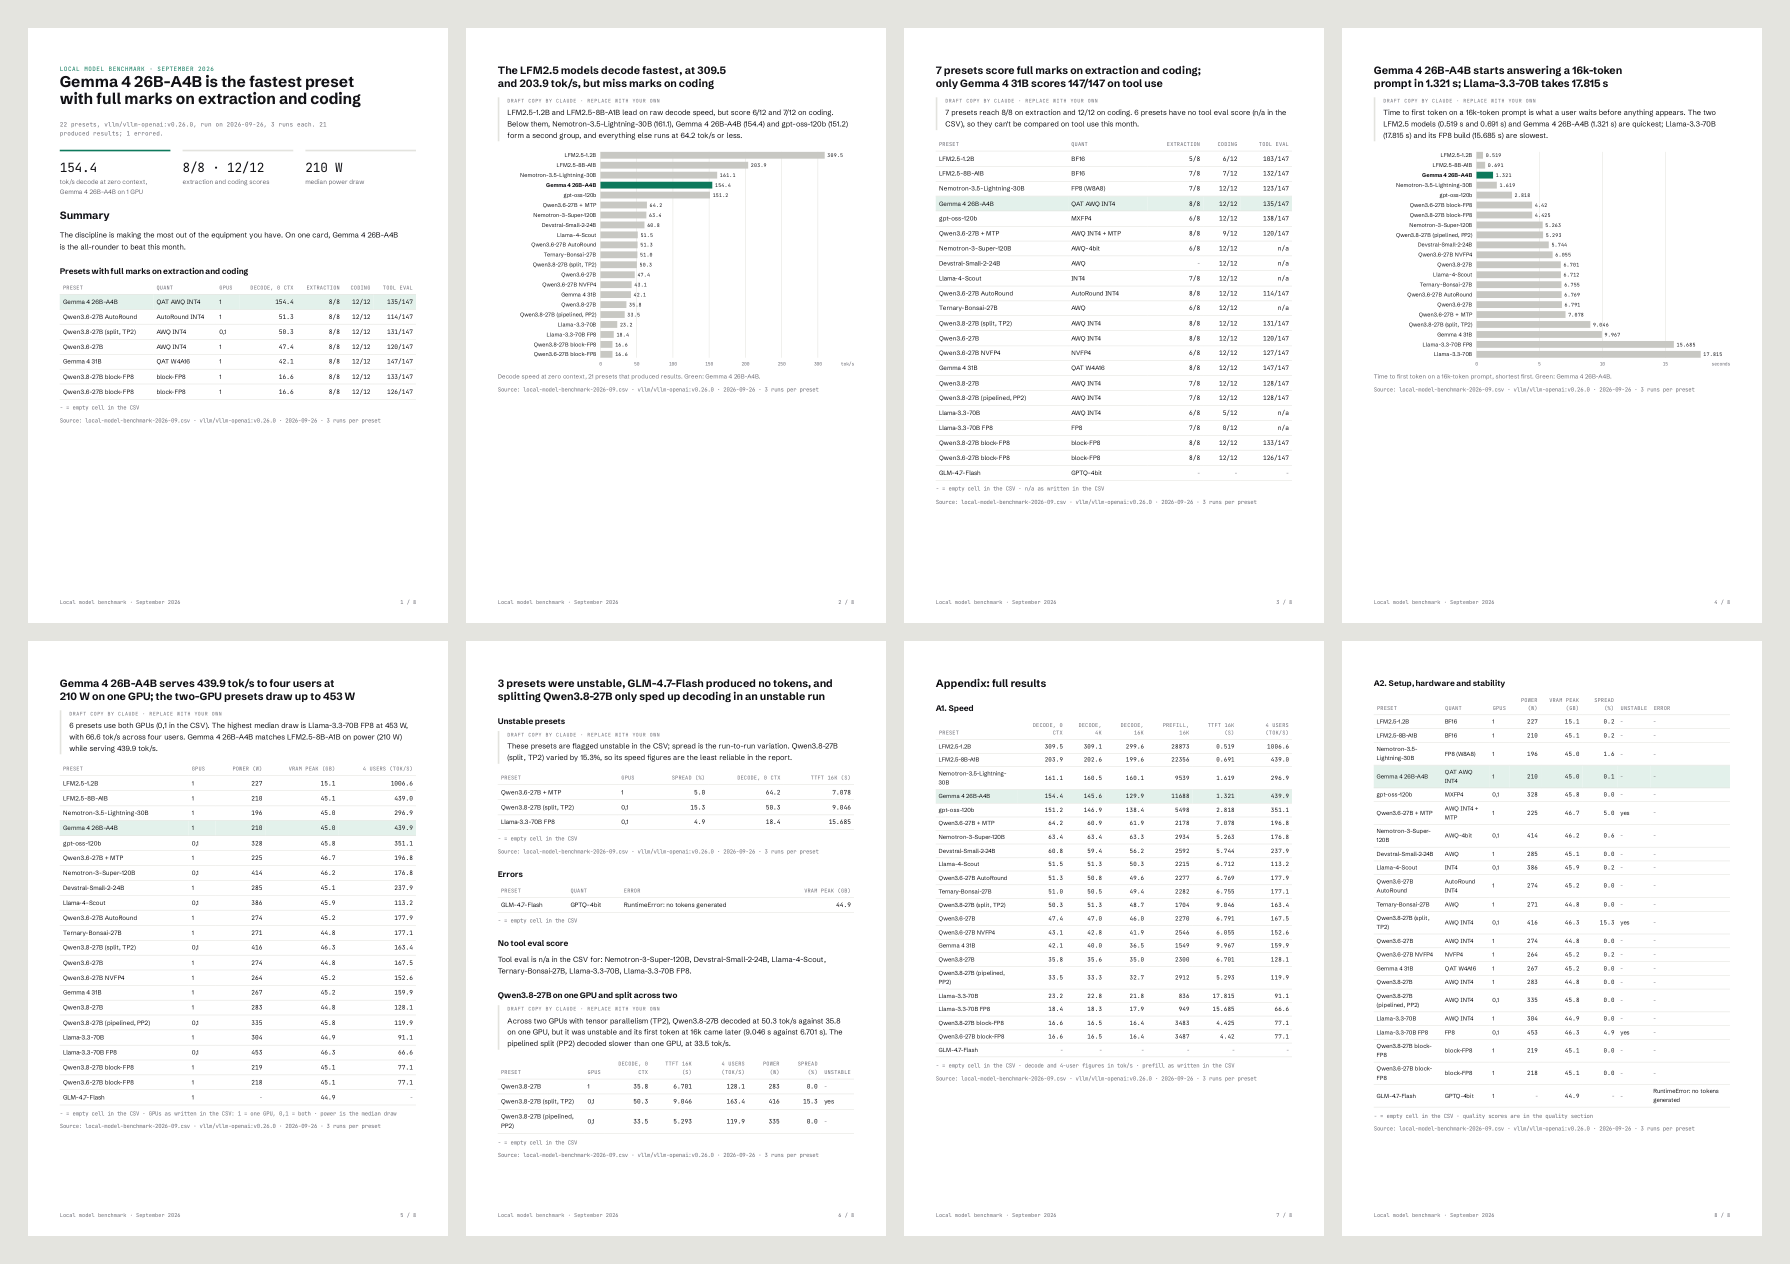
The PDF came out at 8 A4 pages with the house fonts embedded. The zip makes next month quicker, because it holds the scripts and the words file Claude used to build the report:
2026-09-report.pdf        the report: 8 A4 pages
2026-09-report-build.zip
  README.md               the monthly steps
  build_data.py           CSV > report-data.json (every number, straight from the CSV)
  copy-2026-09.json       this month's words, with numbers pulled in as tokens
  build_report.py         words + data > report.html > the PDF and page images
  check.py                every table cell, chart bar and worded claim against the CSV
  tokens.css, report.css  the house style
  fonts/                  the two house fonts, so nothing loads from the web
Anthropic says files can be up to 30MB each, for uploads and downloads, and you can save them straight to Google Drive instead of downloading.
Next month: the same report with new numbers
Having the old template to hand obviously helps, and the build zip is that template, with the words and the numbers kept apart. The README Claude wrote for it has four steps:
1. `python3 build_data.py <month>.csv` writes report-data.json (every number, straight from the CSV).
2. Copy last month's `copy-YYYY-MM.json`, rewrite the words. Pull numbers with tokens, never type them:
   `[[Preset name|column]]`, `[[pick|column]]`, `[[count.full_marks]]`, `[[meta.date]]`.
   Paragraphs under `draft` print with a DRAFT tag; paragraphs under `copy` print as yours.
3. `python3 build_report.py copy-YYYY-MM.json` writes report.html, YYYY-MM-report.pdf and page images in pages/.
4. `python3 check.py <month>.csv YYYY-MM-report.pdf copy-YYYY-MM.json` checks every table cell, chart bar and
   worded claim against the CSV, and flags any number typed into the copy file. Exit code 0 = no mismatches.
   The claims list in check.py names this month's presets: update it when the words change.
Each month, a new CSV goes in and you rewrite the words in one file. Numbers are pulled into those words with tokens, which means they're filled in from the CSV rather than typed by you. Then you build and run the check.
I haven't built October's report yet, so this part is untested, but you shouldn't need to run any of that yourself. Start a new chat, attach the new CSV along with last month's PDF and build files, and ask Claude for the same report. The check's list of claims still names last month's model setups, so tell Claude to update it for the new words.
Where it goes wrong
Anthropic's own help page says Claude "can write things that might look correct but are very mistaken", and my number check only looks at the numbers. A few other things came up on my run, and I'm sharing them so you can catch them on yours.
Units the file doesn't give
My CSV has no unit for decode speed, so Claude labelled it tok/s and asked me to confirm. I didn't answer that in my feedback round, and tok/s went onto the speed chart and into the tables unconfirmed. It happened to be right, but answer questions like that when Claude asks them.
Empty cells
The number check passed with "(blank)" printed all over page 8, because those cells matched the empty cells in the CSV. You'll only catch that sort of thing by reading the pages in the preview.
Fonts
Claude couldn't load the house fonts from Google Fonts in its environment, so it used local copies of the same two fonts. The PDF still came out in them, and the build zip keeps those copies in its fonts folder for next month. Putting the font files in the Skill itself should mean Claude never has to reach for Google Fonts, though I haven't tested that.
Where to go from here
Pick the report you rebuild every month, export its data to a CSV, and run the prompt above with it. If you want the same data as a deck, built in Claude Code, read how to make a presentation with Claude. If you haven't set Claude up yet, start with the Claude Desktop beginners guide. The numbers in my report all came from how to benchmark vLLM, which covers the same 22 model setups.
Continue reading.
- How-to GuidesHow to Make a Presentation with Claude
- How-to GuidesHow to Benchmark vLLM: Find the Best Model, Quant and Settings for Your GPU
- How-to GuidesClaude Code Memory: How to Keep It Useful
- How-to GuidesHow to set up an MCP gateway with Docker
- How-to GuidesHow to Use the Gemini API (and Why I Run It Next to Claude)
- AI ToolsHow to do an SEO audit with Claude