How to Make a Presentation with Claude
In today's post I'm sharing how I make presentations with Claude, a way of working that keeps my time on the data and my insight rather than on PowerPoint. Claude writes the storyline first and puts every number in one data file, Gemini draws the charts, and the same source builds both a PDF and an editable PowerPoint file. When next month's numbers arrive, the deck rebuilds in under three minutes.
 Richard Baxter AI Ops & Marketing Engineer
 On this page
- Is this the right way to make your deck?
- What you need before you start
- The prompt that builds the whole deck
- Plan the deck before you open anything
- Draw the charts as SVG with Gemini
- Build the slides in HTML and print them to PDF
- Make an editable PowerPoint file with PptxGenJS
- Next month: change the data and rebuild
- Gotchas
- Where to go from here
Some decks come round again and again. Think of a monthly report, a finance presentation or a client deck: the layout barely changes, but the numbers do, and each time the work goes on arranging slides instead of reading what the numbers say. That's the genesis of the way I make presentations with Claude. I wanted to focus more on the data and my insight and less on looking at PowerPoint. Also, a bad PowerPoint deck is too easy to make, and bad ones look bad.
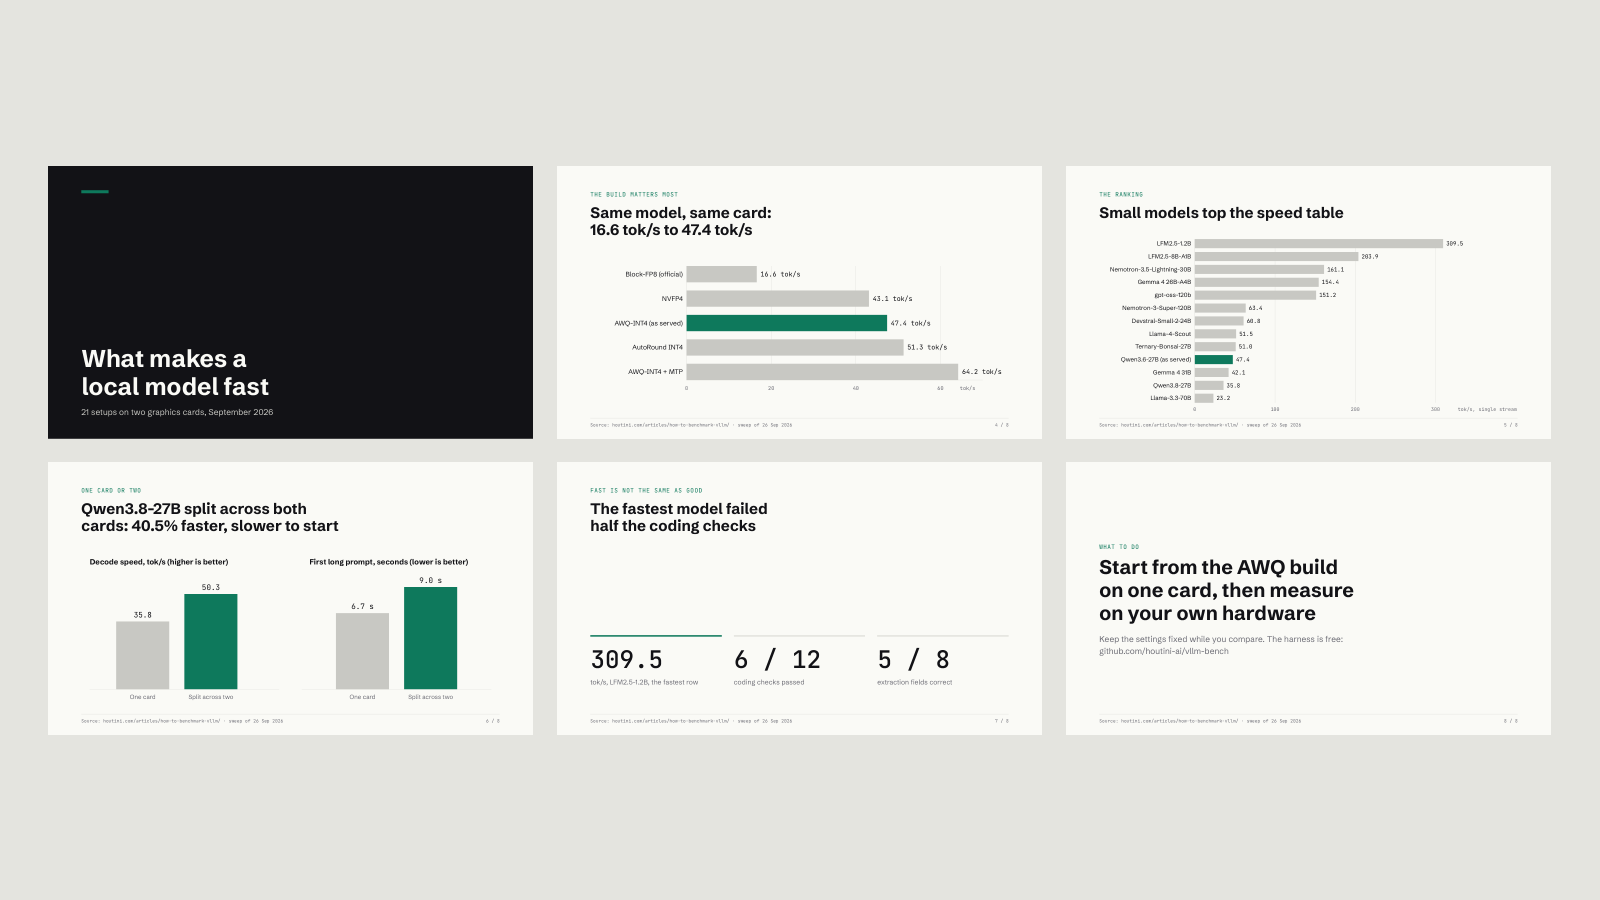
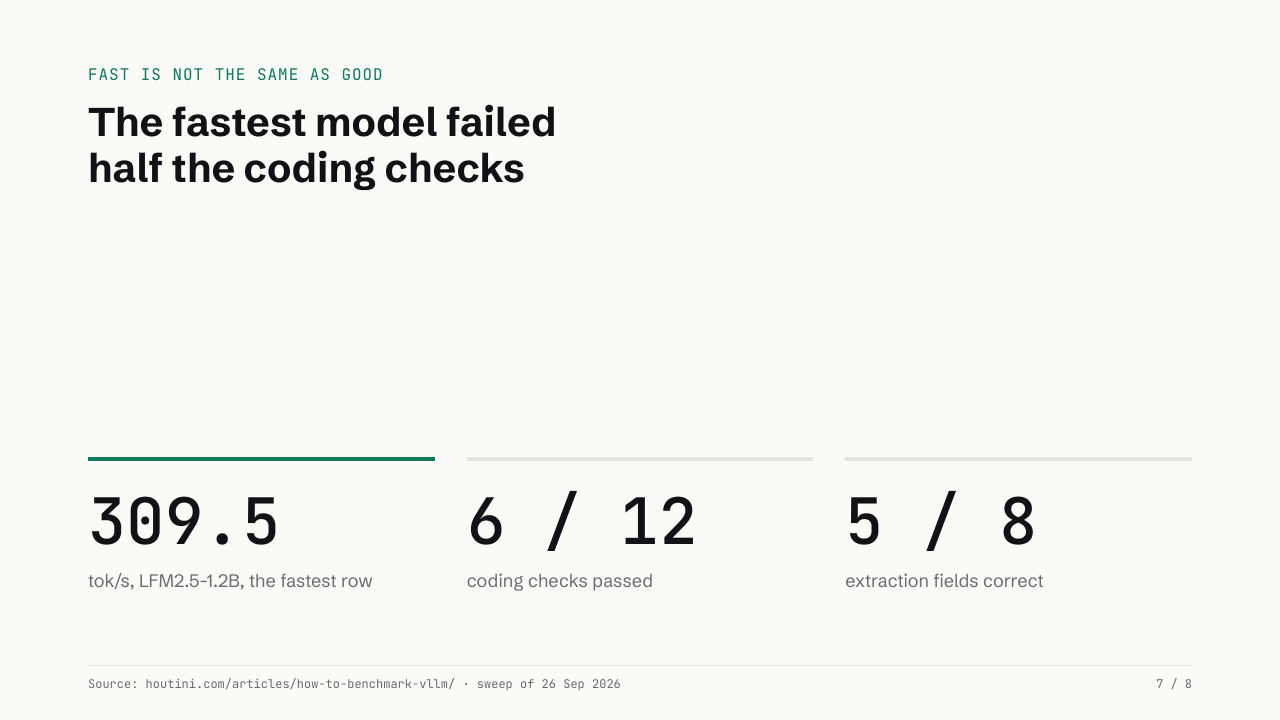
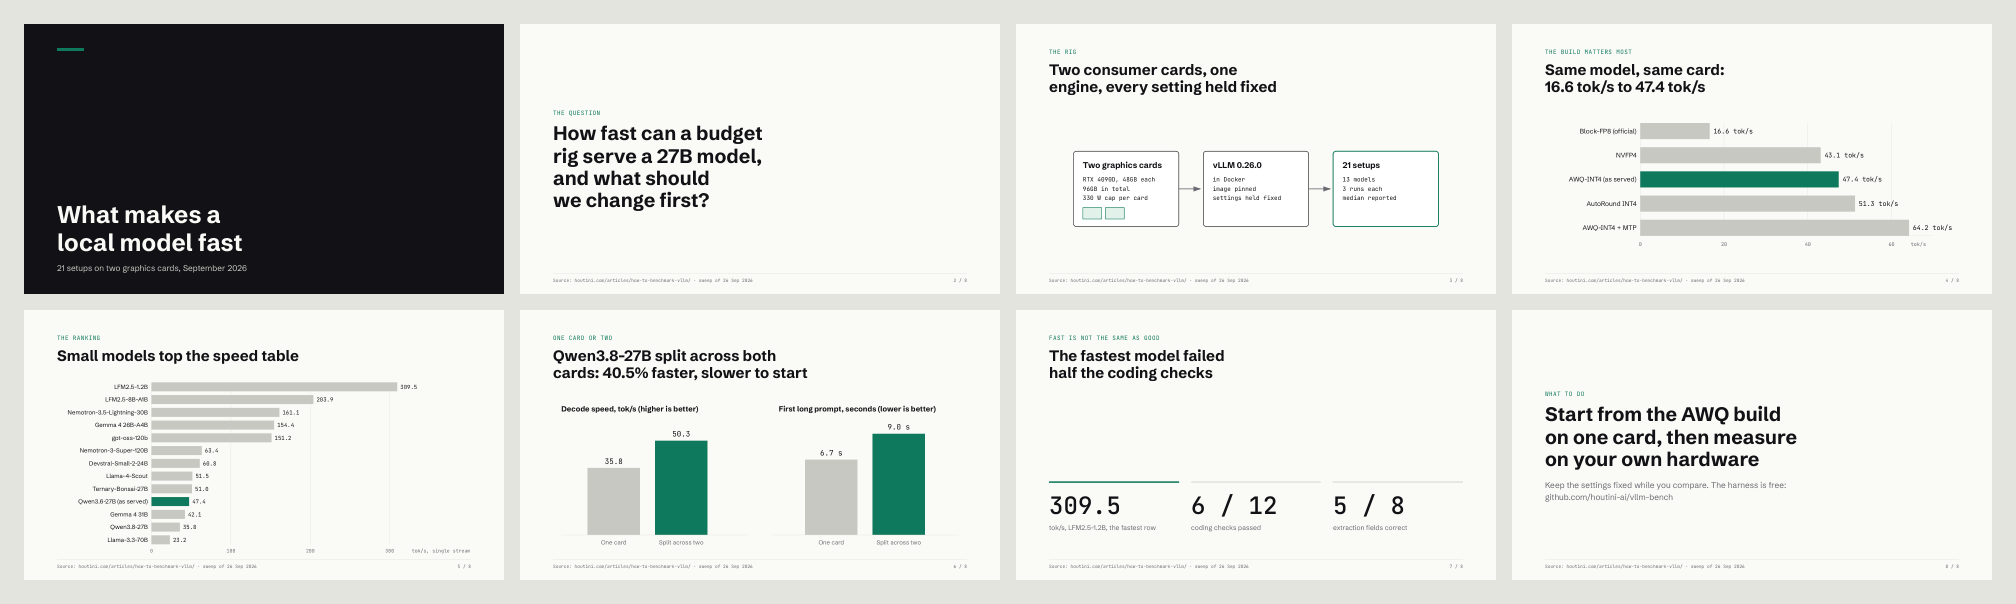
You'll finish with the same presentation in two forms, a PDF and an editable .pptx (PowerPoint's own file format). Claude Code builds both from a storyline and one data file, and Gemini draws the charts. We make a lot of decks this way, in this order: narrative, research (every number into one data file), style, the Gemini-drawn SVG charts, then the PDF. The worked example is an 8-slide deck built from my published vLLM benchmark, and rebuilding both files from the data takes under three minutes. You'll need Claude Code on a paid plan, a free Gemini API key for the charts, Google Chrome, Python and Node.
Quick Navigation
Is this the right way to make your deck? |
What you need before you start |
The prompt that builds the whole deck |
Plan the deck before you open anything |
Draw the charts as SVG with Gemini |
Build the slides in HTML and print them to PDF |
Make an editable PowerPoint file with PptxGenJS |
Next month: change the data and rebuild |
Gotchas |
Where to go from here
Is this the right way to make your deck?
This method is great for repetition, where the template is static but the data evolves. The storyline and the numbers live as files on disk, so the design is done once and every new version of the deck is an edit to the data.
For a one-off deck, the tools that make the slides for you directly are a better fit. Claude creates .pptx files on every plan, Free included, once "Code execution and file creation" is switched on under Settings > Capabilities. The Claude for PowerPoint add-in (Pro and above) builds and edits slides inside PowerPoint from your own template, with native PowerPoint charts. Anthropic doesn't recommend the add-in for final client deliverables without a human review. Copilot in PowerPoint drafts a deck from a prompt or from a Word document.
What you need before you start
The build runs in Claude Code, and the charts come from gemini-mcp, my MCP server for Gemini. An MCP server is a small add-on that gives Claude new tools to call. This one lets Claude ask Google's Gemini models to draw images and SVGs. The full setup for Claude Desktop and Claude Code is in how to make SVGs with Claude and Gemini MCP, and adding it to Claude Code is one line:
claude mcp add -e GEMINI_API_KEY=your-api-key-here -s user gemini -- npx -y @houtini/gemini-mcpThe key costs nothing to start with: generate_svg's default model, Gemini 3 Flash Preview, is on Google's free tier, while Gemini 3.1 Pro Preview is paid only. On the free tier, Google says what you send can be used to improve its products, so keep client numbers out of a chart prompt unless your key is on a paid plan.
- Claude Code on a paid Claude plan.
- gemini-mcp (the package @houtini/gemini-mcp, version 2.8.1) with a Gemini API key from Google AI Studio.
- Google Chrome, any current version.
- Python 3, for the template script.
- Node 20 or later, for PptxGenJS.
- PowerPoint, only to check the .pptx. You don't need it to build one.
If you're signing up to Claude for this, new accounts get a free week of Claude Code.
The prompt that builds the whole deck
Put your notes in a file called notes.md in an empty folder, open that folder in Claude Code and paste the prompt below.
Make me a presentation from notes.md in this folder. Work in this order and stop to show me the storyline before you build anything:

1. Storyline: one message per slide, written as the slide title, 6 to 8 slides. Say who it's for and the one thing they should leave with. Save it as storyline.md.
2. Data: put every number, title and speaker note into deck-data.json. Use only numbers from my notes.
3. Style: 16:9 at 1280 x 720, off-white background, near-black text, one accent colour; a heading font and a mono font for numbers from Google Fonts. One message per slide, a chart only where there is a number.
4. Charts: use Gemini's generate_svg to draw each chart as an SVG with the exact numbers, fonts and colours, no titles or legends. Check every bar length and label against the data before using it, and keep every label inside the canvas.
5. PDF: write build_deck.py that turns deck-data.json and the SVGs into deck.html, one 1280 x 720 page per slide. Put the SVGs inline (not as <img>) and prefix each SVG's class names so their styles can't clash. Print it with headless Chrome: --headless=new --no-pdf-header-footer --virtual-time-budget=10000 --print-to-pdf.
6. PowerPoint: write build_pptx.js with PptxGenJS that builds deck.pptx from the same deck-data.json: real text boxes, the SVGs as images, speaker notes, Arial and Consolas so it looks right on any machine.
7. Show me each page of the PDF as an image and tell me anything you had to change.
Steps 1 to 6 each have a section of their own below, in the same order. The prompt stops after the storyline on purpose, so you approve the story before anything gets drawn. Read storyline.md, and if it says what you want it to say, tell Claude to carry on.
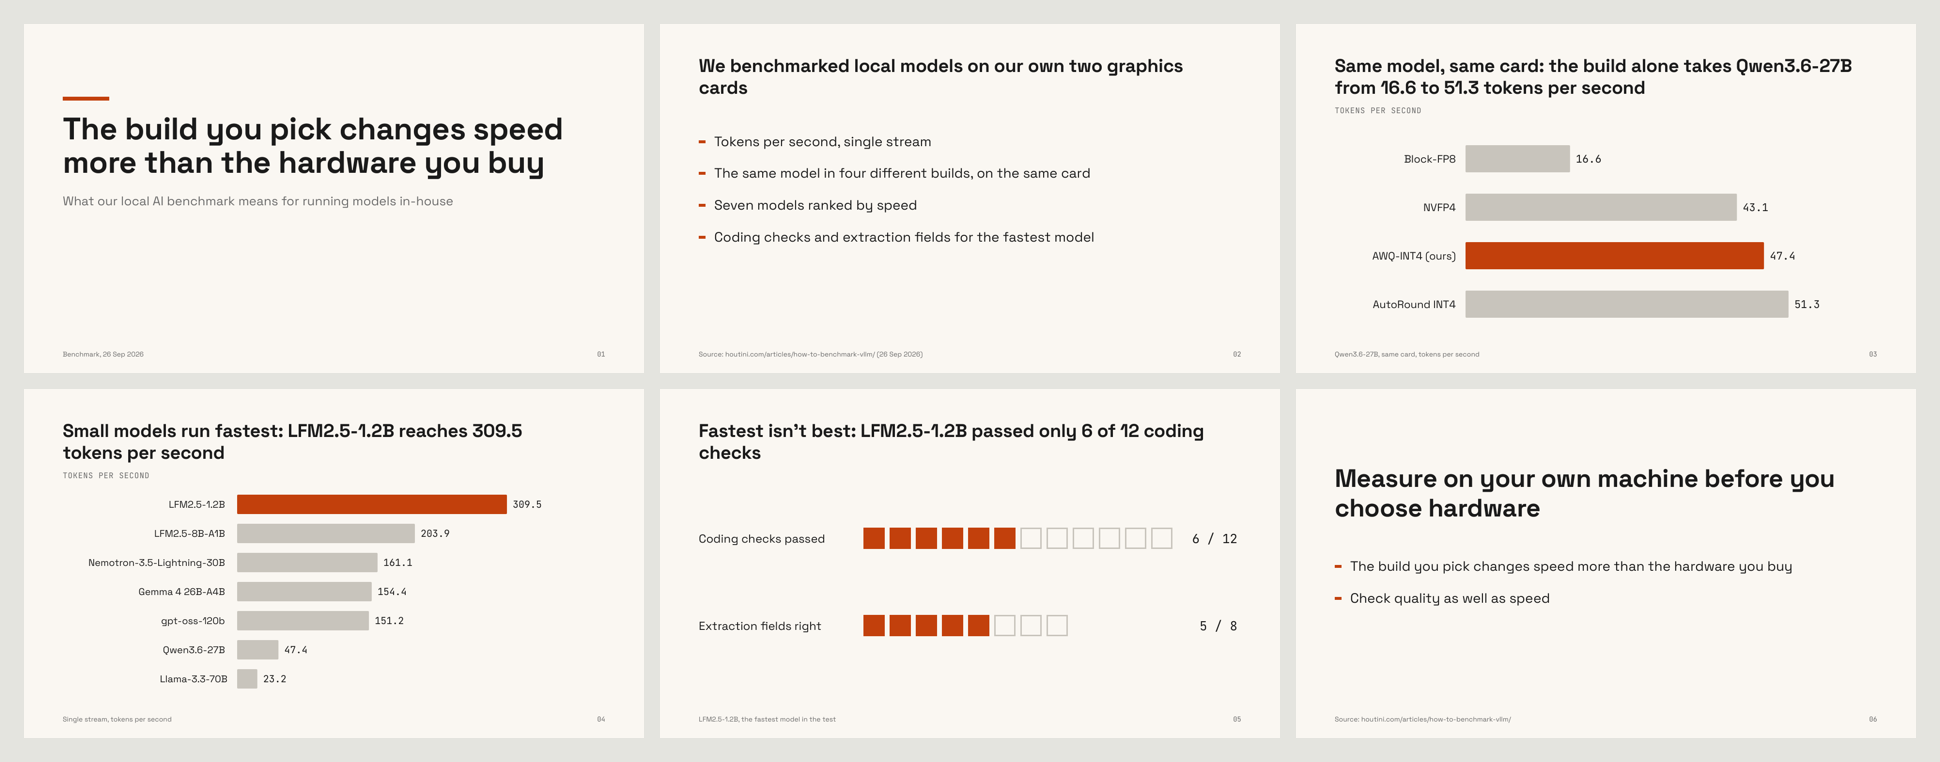
To test it, a fresh Claude session on my machine got the prompt verbatim, with nothing in the folder but a short notes file from my vLLM benchmark. About 15 minutes and 34 tool calls later it had a 6-slide storyline, a data file, three Gemini charts, a 6-page PDF and a matching .pptx with speaker notes on every slide, and every bar length and label matched the notes. It chose its own palette and fonts, because the prompt leaves those open. It caught a "6 / 12" label overlapping a square on one chart and tightened the layout. Two titles still wrapped with one word on the second line, and it didn't open the .pptx in PowerPoint. Expect small fixes like these along the way; the last step asks Claude to tell you about them.
Plan the deck before you open anything
Nothing gets designed until the story and the numbers are written down. Both are plain files that Claude writes and you read, and they're what make next month quick.
Write the storyline, one message per slide
The storyline is one message per slide, written as that slide's title. At the top go the audience and the one thing they should leave with. There's no design at this stage, only the argument, in the order it'll be made.
Audience: a team deciding whether to run AI models on their own hardware.
The one thing they should leave with: the build and settings you choose move speed more than the hardware you buy.

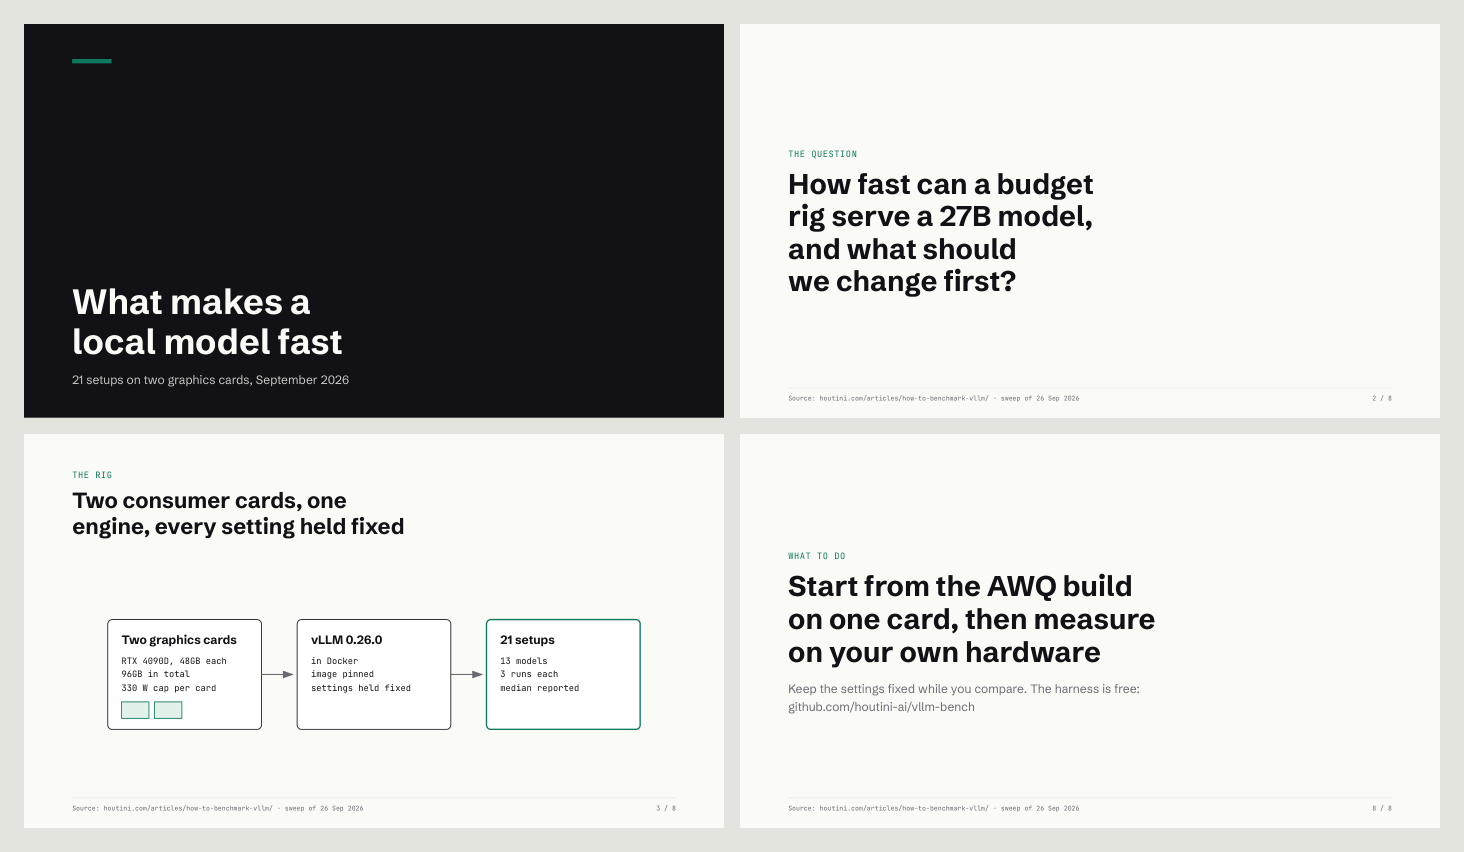
1. Cover - What makes a local model fast. 21 setups on two graphics cards, September 2026.
2. The question - How fast can a budget rig serve a 27B model, and what should we change first?
3. The rig - Two RTX 4090D 48GB cards, 330 W cap each, vLLM 0.26.0 in Docker. 21 setups, three runs each.
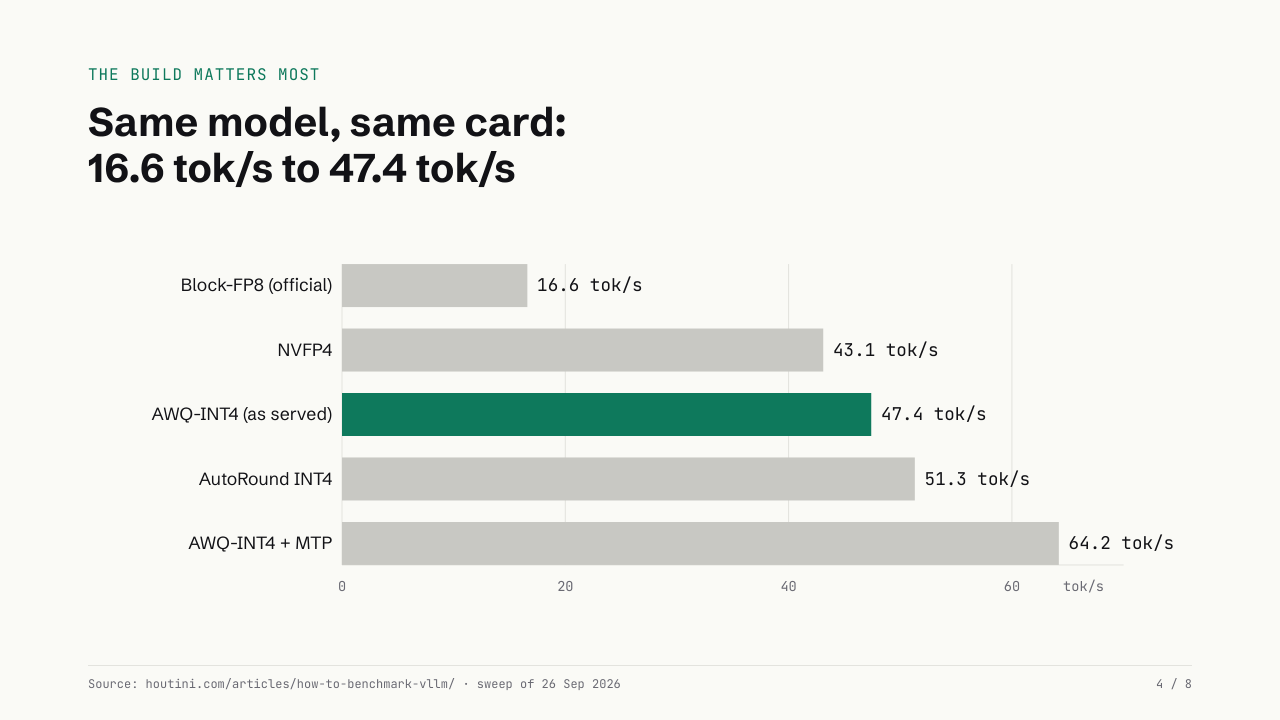
4. The build matters most - Same model, same card: 16.6 tok/s (block-FP8) to 47.4 tok/s (AWQ-INT4, as served).
The storyline is where the insight goes in, before fonts and colours can get in the way.
Put every number in one data file
Next, every title, number, chart file and speaker note goes into one data file, deck-data.json. JSON is a plain-text format for structured data: names and values inside curly brackets, easy for a person to read and for a script to use. Speaker notes are the notes a presenter sees under each slide that the audience doesn't.
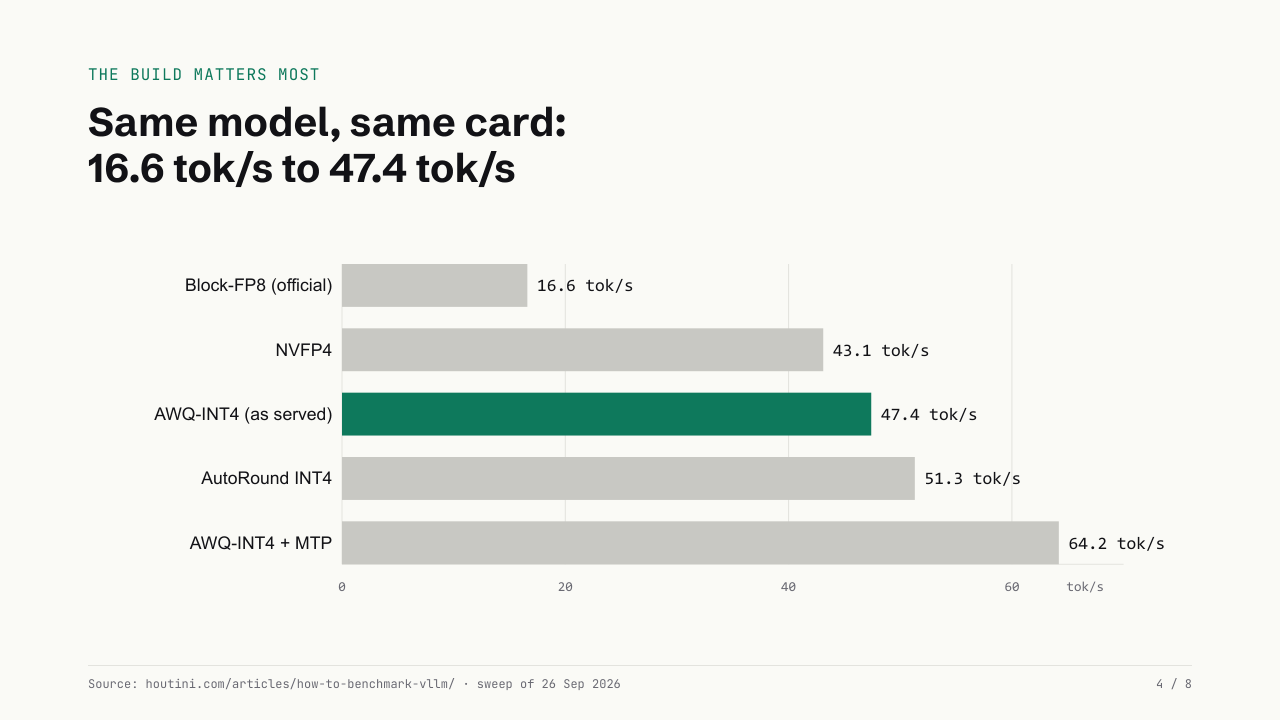
The numbers in my example deck came straight from my benchmark article's verified facts, such as 16.6 to 64.2 tokens per second (tok/s) across the five builds of Qwen3.6-27B.
{
  "type": "chart",
  "kicker": "The build matters most",
  "title": "Same model, same card: 16.6 tok/s to 47.4 tok/s",
  "svg": "svg/quant-ladder.svg",
  "notes": "Qwen3.6-27B on one card. The AWQ-INT4 build is the one in daily use. MTP adds speed but at a cost, so it stays off."
}
This file is the only thing that changes when the numbers change. The template and the build scripts never do.
Set the house style once
The house style is decided once, in a short file Claude follows every time. Mine sets the page at 16:9, 1280 x 720 pixels, builds a small palette around one green accent, and uses Schibsted Grotesk for the words and JetBrains Mono for the numbers.
- Page: 16:9, 1280 x 720 px, one slide per printed page.
- Paper #FAFAF7 · Ink #121216 · Muted #6B6B73 · Rule #E4E4DF · Accent (Houtini green) #0F7A5C · Accent wash #E3F1EB
- Headings: Schibsted Grotesk 700. Body: Schibsted Grotesk 400. Numbers and labels: JetBrains Mono.
- One message per slide, written as a sentence in the slide title. A chart only where there is a number.
- Charts: flat bars, no gradients, no shadows, no 3D. The bar the slide is about is accent green; every other bar is #C9C9C4. Values printed at the end of each bar in JetBrains Mono.
- Footer on every content slide: source line left, slide number right, 12px, muted.
Most of the look comes from the rules rather than the colours. Claude reads the file on every build, so next month's deck comes out looking like this month's.
Draw the charts as SVG with Gemini
The charts are SVGs drawn by Gemini through gemini-mcp. An SVG is a picture described as shapes and text rather than pixels, which means it stays sharp at any size and can be edited later.
Ask for the exact chart
gemini-mcp's generate_svg tool takes a prompt, a width and height, a style (technical, artistic, minimal or data-viz) and an outputPath, which saves the SVG straight to disk where the template can find it. Gemini draws what the prompt describes, so the prompt carries everything: the exact values, the canvas size, the colours, the fonts, and "no title, no legend, no shadows, no gradients", because the slide already has a title.
generate_svg
  prompt:     A horizontal bar chart, 1100x440, transparent background. Title: none (the
              slide carries the title). Five bars, top to bottom, labels on the left in
              "Schibsted Grotesk", sans-serif 18px colour #121216, values at the end of each
              bar in "JetBrains Mono", monospace 18px colour #121216, scale from 0 to 70 tok/s
              with the bar lengths exactly proportional to the values:
              1. "Block-FP8 (official)" 16.6 tok/s - bar colour #C9C9C4
              2. "NVFP4" 43.1 tok/s - bar colour #C9C9C4
              3. "AWQ-INT4 (as served)" 47.4 tok/s - bar colour #0F7A5C
              4. "AutoRound INT4" 51.3 tok/s - bar colour #C9C9C4
              5. "AWQ-INT4 + MTP" 64.2 tok/s - bar colour #C9C9C4
              Value labels read e.g. "16.6 tok/s". Bars 44px tall, 22px gaps, square ends.
              Leave 260px on the left for labels. A thin baseline at 0 in #E4E4DF, light
              vertical gridlines at 0, 20, 40, 60 in #E4E4DF with tick labels "0", "20",
              "40", "60" in JetBrains Mono 14px #6B6B73 under the axis. No title, no legend,
              no shadows, no gradients.
  style:      data-viz
  width:      1100
  height:     440
  outputPath: run/svg/quant-ladder.svg
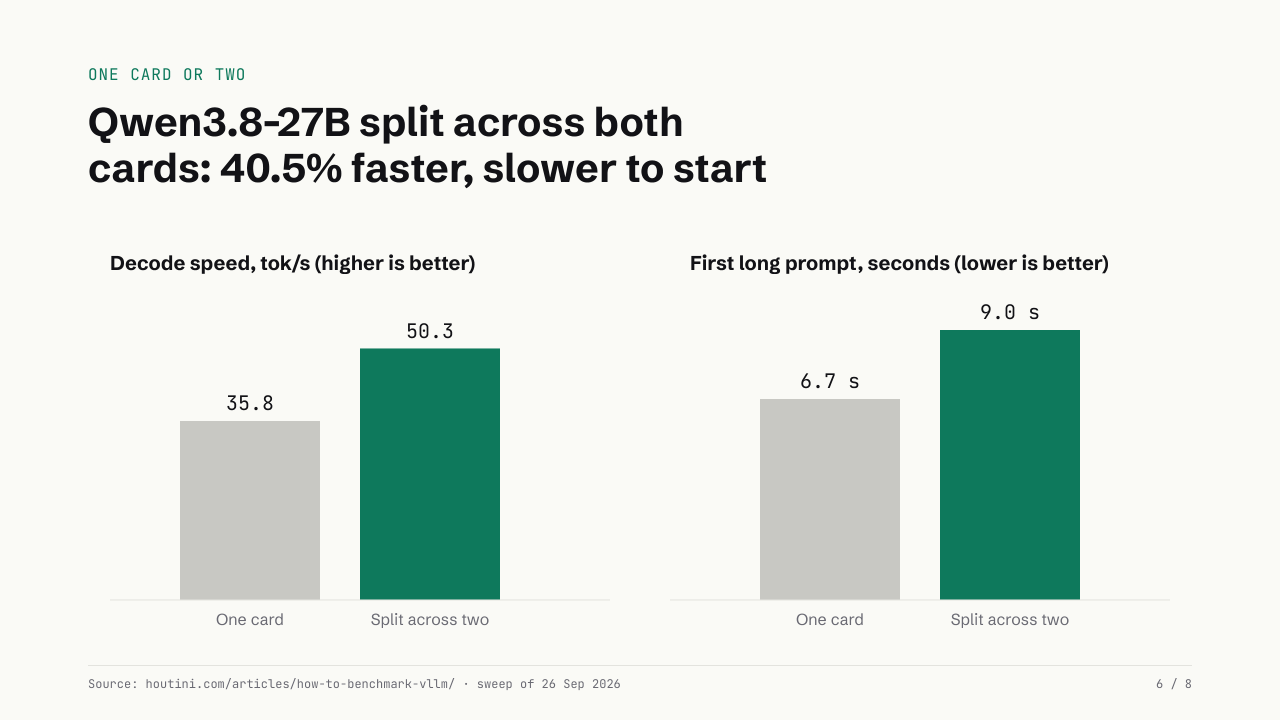
My example deck needed four of these. Three were bar charts: the five builds of Qwen3.6-27B, 13 models ranked on a single stream, and Qwen3.8-27B on one card against the same model split across two. The fourth was a three-box diagram: the rig > vLLM > 21 setups.
Check every chart against the data
Before a chart goes on a slide, check it against the data file. Claude can do this by reading the SVG itself. Divide each bar's length by its value and you should get the same answer for every bar. On the demo's ladder chart it was 11.43 pixels per tok/s on all five.
Then check the names. The ranking prompt used short model names, "Lightning" and "Bonsai", and Gemini draws exactly what the prompt says, so the chart used them too. The data file has the full names, Nemotron-3.5-Lightning-30B and Ternary-Bonsai-27B among them, and swapping those into the SVG text fixed it. When you write the prompt, ask for room on the right for the value labels. The ranking prompt asked for 130 px free on the right, and every label landed inside the canvas.
Build the slides in HTML and print them to PDF
The slides are one HTML page, printed to PDF. I like the method to PDF we use.
Write the template
A template, here, is a small script that pours the data into a fixed layout. build_deck.py reads deck-data.json and the SVGs and writes deck.html, with one 1280 x 720 section per slide and four slide types: cover, statement, chart and stats. Three short CSS rules do the printing. @page sets each PDF page to exactly 1280 x 720 with no margin. print-color-adjust: exact keeps the background colours, which browsers can drop by default when printing to save ink. break-after: page then puts each slide on a page of its own.
The SVGs go into the page inline, as markup rather than as <img> tags, and each chart's class names get the chart's file name as a prefix. Both of those came out of the first two prints, and the Gotchas below have the detail.
Print it with headless Chrome
Headless Chrome is Google Chrome running with no window, so a script can hand it a page and get a PDF back.
"C:\Program Files\Google\Chrome\Application\chrome.exe" --headless=new --disable-gpu --no-pdf-header-footer --virtual-time-budget=10000 --print-to-pdf="deck.pdf" "file:///C:/.../run/deck.html"

262154 bytes written to file deck.pdf
--print-to-pdf saves the page as a PDF. --no-pdf-header-footer drops the date, file path and page number Chrome would otherwise stamp on every slide. --virtual-time-budget=10000 gives the web fonts time to load before the print. On current Chrome, plain --headless already runs the new mode, so the =new is harmless but not needed. The demo printed 8 pages at 1280 x 720 in about 3.5 seconds. Chrome sometimes prints an unrelated error line about its own web-app installer, and the PDF is written regardless.
Make an editable PowerPoint file with PptxGenJS
Sometimes the person on the other end needs to change the deck in PowerPoint. The same data file builds a .pptx as well, so the numbers and titles in the two versions always match.
Build the .pptx from the same data
PptxGenJS is a JavaScript library that writes .pptx files. build_pptx.js reads the same deck-data.json and builds deck.pptx at PowerPoint's own widescreen size, 13.333 x 7.5 inches, which is the same 16:9 shape as 1280 x 720 pixels. Titles, numbers and footers go in as real text boxes you can click into and edit. The charts go in as SVG, which PowerPoint for Microsoft 365 draws as vector, and the notes from the data file become speaker notes.
// from build_pptx.js: a chart slide's SVG, sized from its viewBox, then the speaker note
const g = svgSize(s.svg);   // g.data = 'image/svg+xml;base64,...'
slide.addImage({ data: g.data, x: X + (boxW - w) / 2, y: top + (boxH - h) / 2, w, h, altText: s.title });
if (s.notes) slide.addNotes(s.notes);
The fonts change to Arial and Consolas. PowerPoint draws text with the fonts installed on the machine that opens the file, and the web fonts don't travel with it, so the .pptx uses fonts that are already there.
Replace the placeholder images
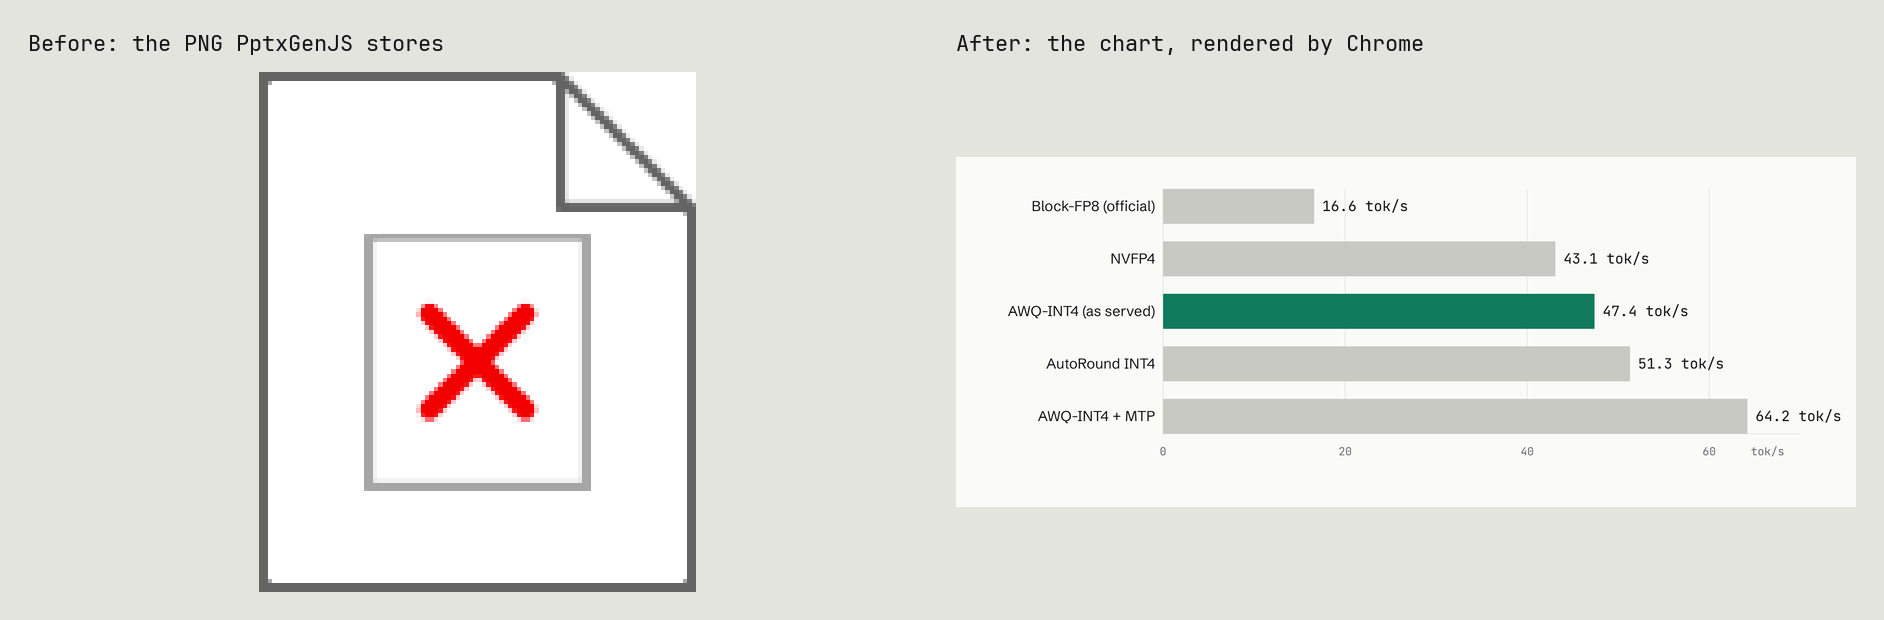
A .pptx stores a PNG fallback beside each SVG: an ordinary picture of the chart, for any app that can't draw SVG. When PptxGenJS runs in Node (the program that runs JavaScript outside a browser, which is how Claude runs it), it doesn't put a picture of your chart there. It stores a generic 100 x 119 broken-image placeholder, the same one for every chart. That's in the library's source code, in 3.12.0 and in the current 4.0.1, and it isn't in the docs. PowerPoint for Microsoft 365 draws the SVG and never shows the fallback, so you won't see it there. The fix is a short script, fix_fallbacks.py, which has Chrome render each SVG to a PNG at twice the size and swaps it into the .pptx in place of the placeholder. Afterwards each fallback was a real chart, 52 to 121 KB.
Open it in PowerPoint
Open deck.pptx in PowerPoint to check it. On my machine, PowerPoint for Microsoft 365 rendered every slide, the titles and numbers were real text boxes, and the charts stayed vector, so they scale cleanly.
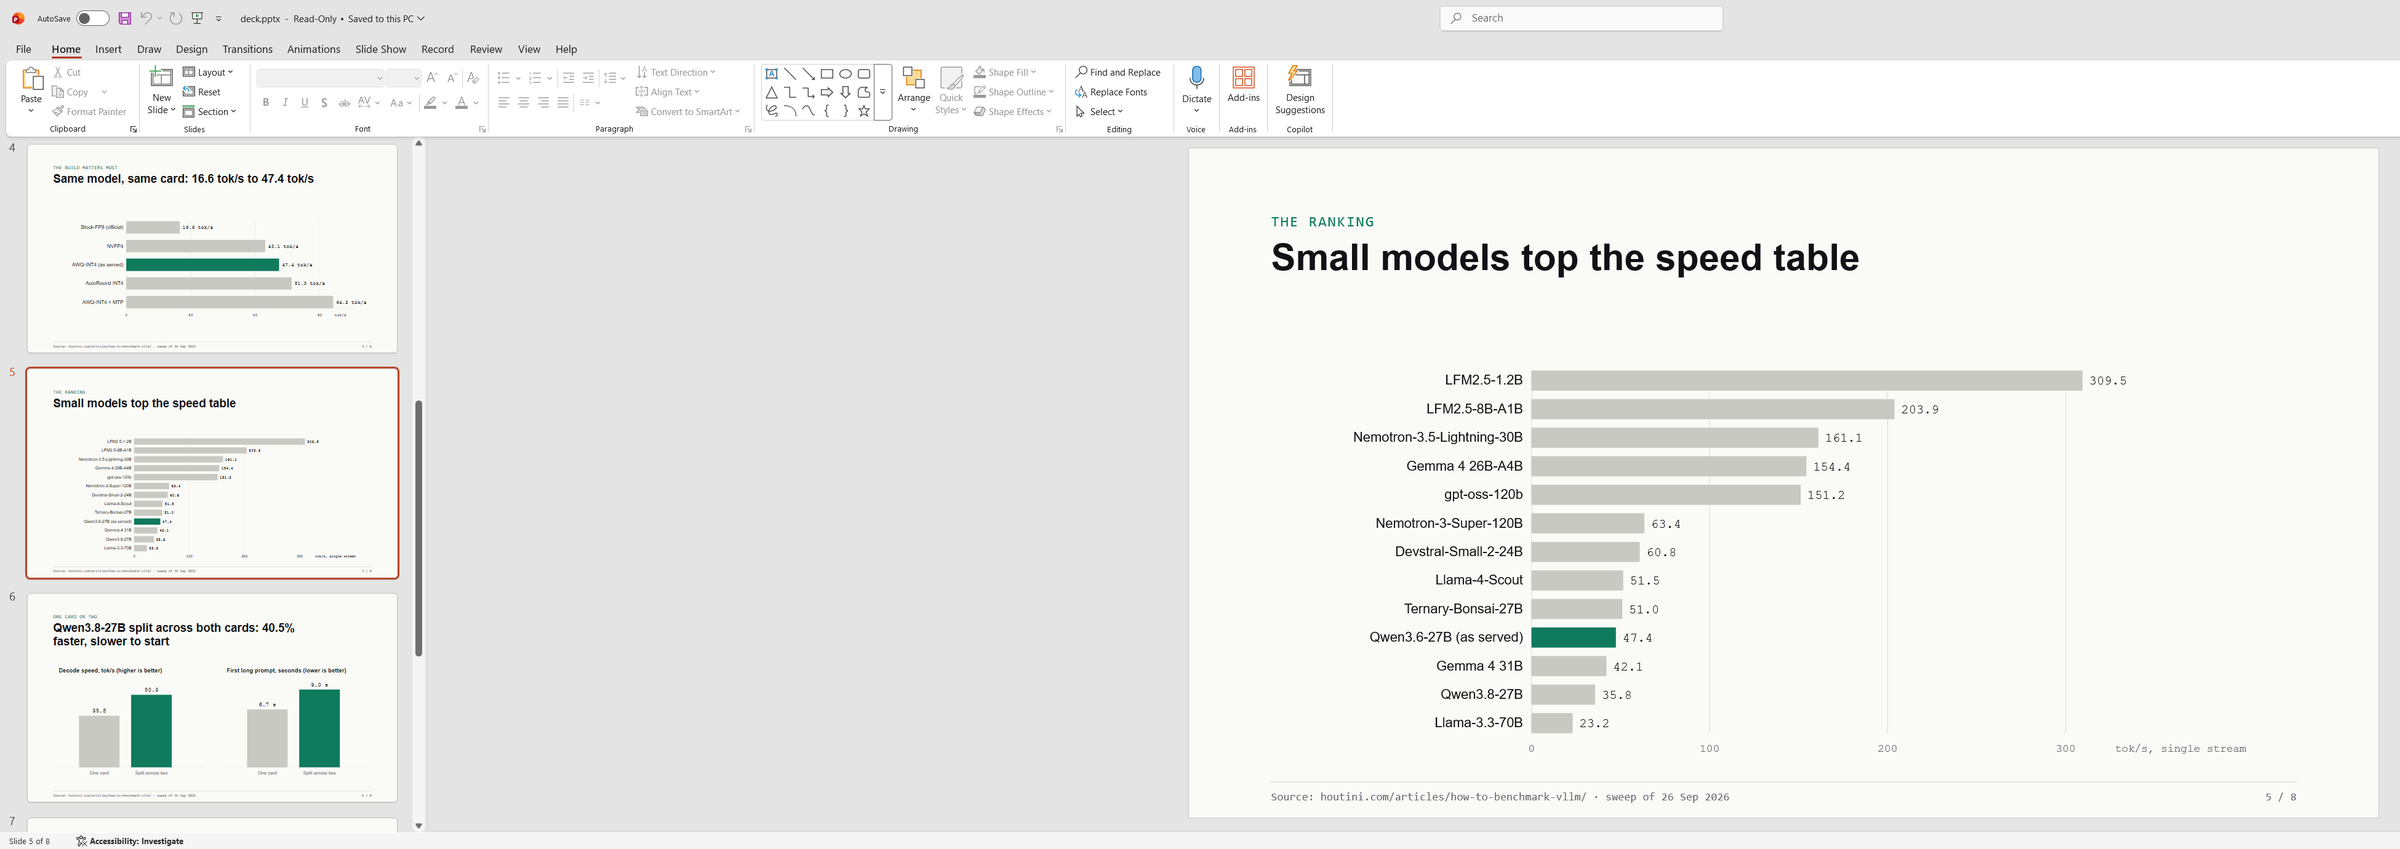
To recolour part of a chart in PowerPoint for Microsoft 365 on Windows, select it and head to Graphics Format > Convert to Shape, which turns it into ordinary PowerPoint shapes. Titles wrap slightly differently from the PDF, because Arial isn't the same width as Schibsted Grotesk, and the text inside the charts falls back to installed fonts. The rig diagram's rounded corners came out square, which is covered in the Gotchas below.
Next month: change the data and rebuild
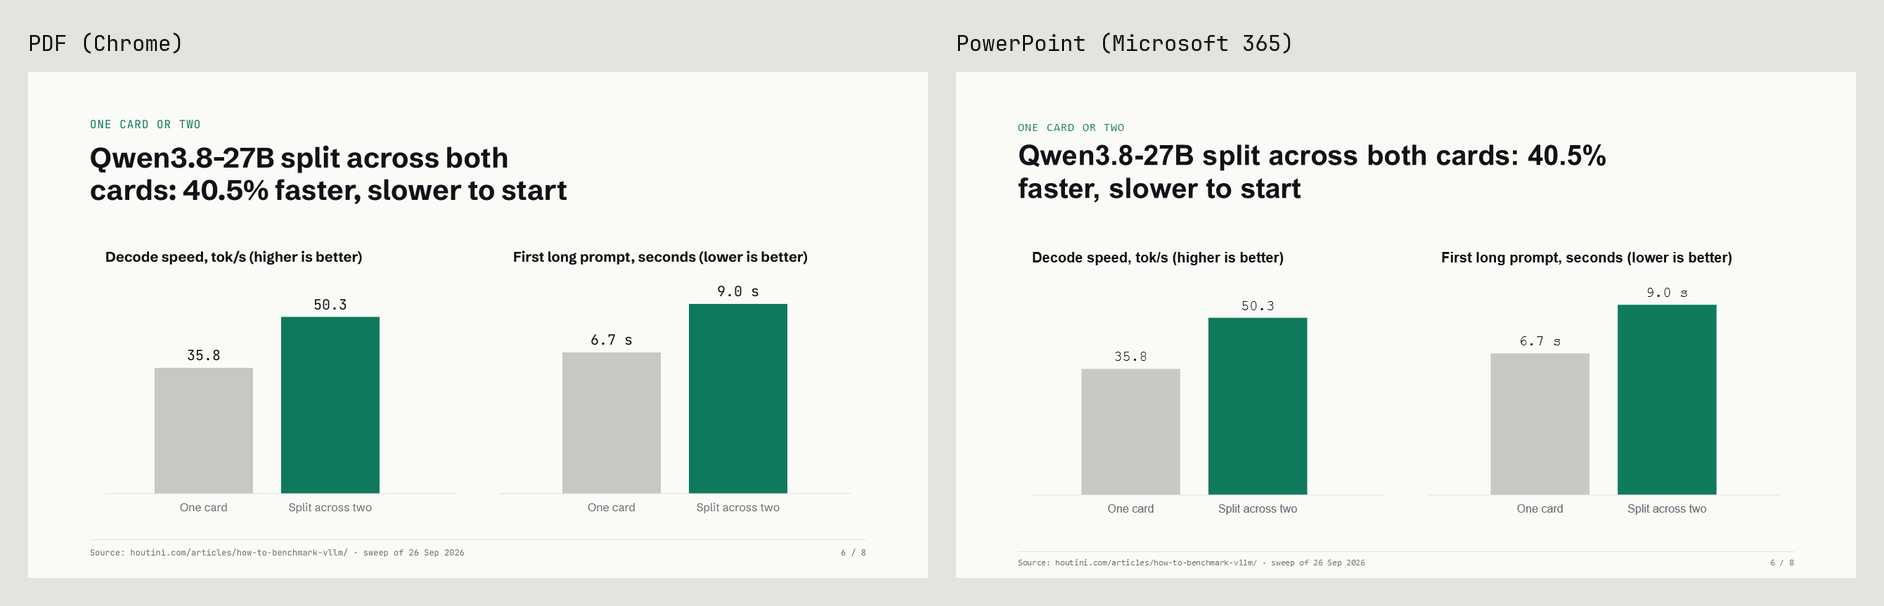
In my example deck, slide 6's title didn't name the model, so Claude changed it in deck-data.json to "Qwen3.8-27B split across both cards: 40.5% faster, slower to start" and rebuilt the deck. The template didn't change.
For a chart that goes into every month's deck, a fresh Gemini call each time is the wrong tool, because each call is a new drawing. So Claude turned the Gemini ranking chart into a small Python script, chart_bars.py, which redraws the same layout from the data: the same fonts, colours, bar height, gaps and tick positions. Next month's version of that chart needs no Gemini call at all. Gemini stays for the one-off diagram and for the first draft of each chart style.
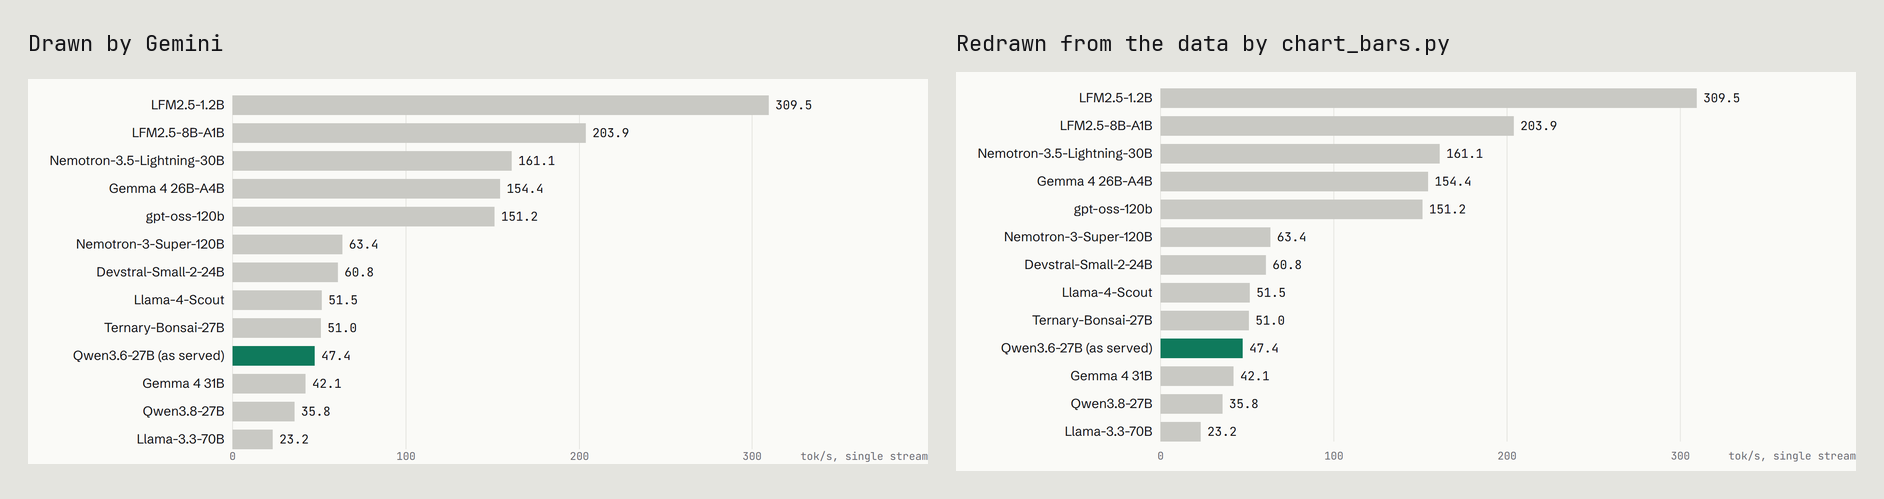
The first version of chart_bars.py printed "51" for Ternary-Bonsai-27B's 51.0, because Python's :g format drops a trailing zero. Formatting to one decimal place, :.1f, fixed it.
python chart_bars.py
python build_deck.py
"C:\Program Files\Google\Chrome\Application\chrome.exe" --headless=new --disable-gpu --no-pdf-header-footer --virtual-time-budget=10000 --print-to-pdf="deck.pdf" "file:///C:/.../run/deck.html"
node build_pptx.js
python fix_fallbacks.py

redrew svg/ranking.svg 13 bars
deck.html 15688 bytes, 8 slides
264576 bytes written to file deck.pdf
wrote deck.pptx
replaced fallbacks for slides ['slide3', 'slide4', 'slide5', 'slide6']
Across four timed rebuilds on my machine, that chain took between 28 seconds and 2 min 39 s. The PDF print takes 3.5 to 7 seconds; the part that varies is fix_fallbacks.py, where Chrome renders the four chart PNGs, which took anywhere from 13 to 49 seconds.
Gotchas
These are the problems the example build hit on my machine, plus one from PptxGenJS's issue tracker. I'm sharing them so they don't turn up in a deck of your own.
The chart text falls back to Arial
The first print placed each chart with an <img> tag. The slide titles came out in the web fonts, but the chart text came out in Arial and Consolas. An SVG loaded as an image is a separate, sealed-off document, so it can't use the page's web fonts (MDN and the W3C's SVG Integration draft describe that sandbox). Fonts installed on the machine still work, which is why Arial turned up. The fix is to put the SVG markup inline in the page instead of using <img>.
The charts break each other's labels
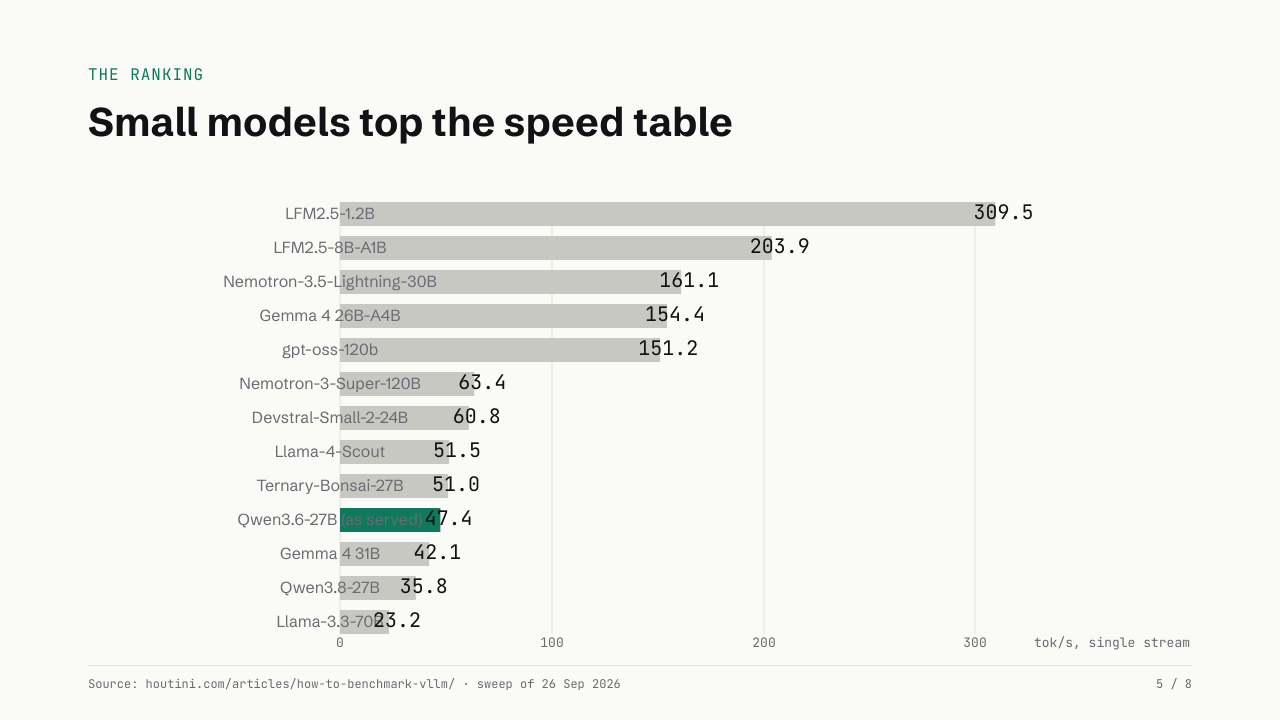
Once inlined, the charts broke: labels slid onto the bars and changed size. Each SVG carries its own style block, and these charts all used the same generic class names in theirs: .label, .value and .grid. Put them on one page and the last chart's rules override the others'. Prefixing every class with the chart's file name when it's inlined (ranking-label, one-vs-two-label) fixed it, and the third print came out clean.
The .pptx charts show a placeholder in apps that can't draw SVG
Any app that reads the PNG fallback instead of the SVG will show PptxGenJS's broken-image placeholder rather than your chart. Swap in real renders, as in the PowerPoint section above.
PowerPoint offers to repair a file with an SVG on the master
A PptxGenJS GitHub issue (#1150, on PptxGenJS 3.11.0) reports that an SVG on the slide master made PowerPoint offer to repair the file when it opened. Keep SVGs off the master, and put a logo there as a PNG.
Rounded corners and fonts go missing in PowerPoint
The rig diagram's rounded corners, set with rx inside the SVG's style block, came out square in PowerPoint and stayed rounded in the PDF. A 2019 answer on Microsoft Q&A says PowerPoint "does not use CSS as a styling mechanism", and that custom @font-face fonts in an SVG aren't supported. Put the geometry and the fonts in plain attributes on each element (rx=, transform=, font-family=) rather than in a style block, and stick to fonts every machine has for the .pptx.
Where to go from here
Start with this month's numbers. Put them in a notes file, open the folder in Claude Code and paste the prompt from earlier in this guide. If gemini-mcp isn't set up yet, how to make SVGs with Claude and Gemini MCP covers it in Claude Desktop and Claude Code. The demo deck's numbers came from how to benchmark vLLM, and if Claude Code is new to you, the complete beginners guide gets it running. Next month, copy deck-data.json, change the numbers and ask Claude to rebuild both files.
Continue reading.
- How-to GuidesHow to Benchmark vLLM: Find the Best Model, Quant and Settings for Your GPU
- How-to GuidesClaude Code Memory: How to Keep It Useful
- How-to GuidesHow to set up an MCP gateway with Docker
- How-to GuidesHow to Use the Gemini API (and Why I Run It Next to Claude)
- AI ToolsHow to do an SEO audit with Claude
- ExplainerWhat is a Marketing Engineer (and do you need one)?