How to Connect Google Trends to Claude Code
Google Trends can now be read by whole category, with no keyword, so I added it to my seo-audit MCP. In today's post we're connecting Google Trends to Claude Code, running the three ways of asking on real data, and having Gemini MCP draw the report, with every prompt included.
 Richard Baxter AI Ops & Marketing Engineer
 On this page
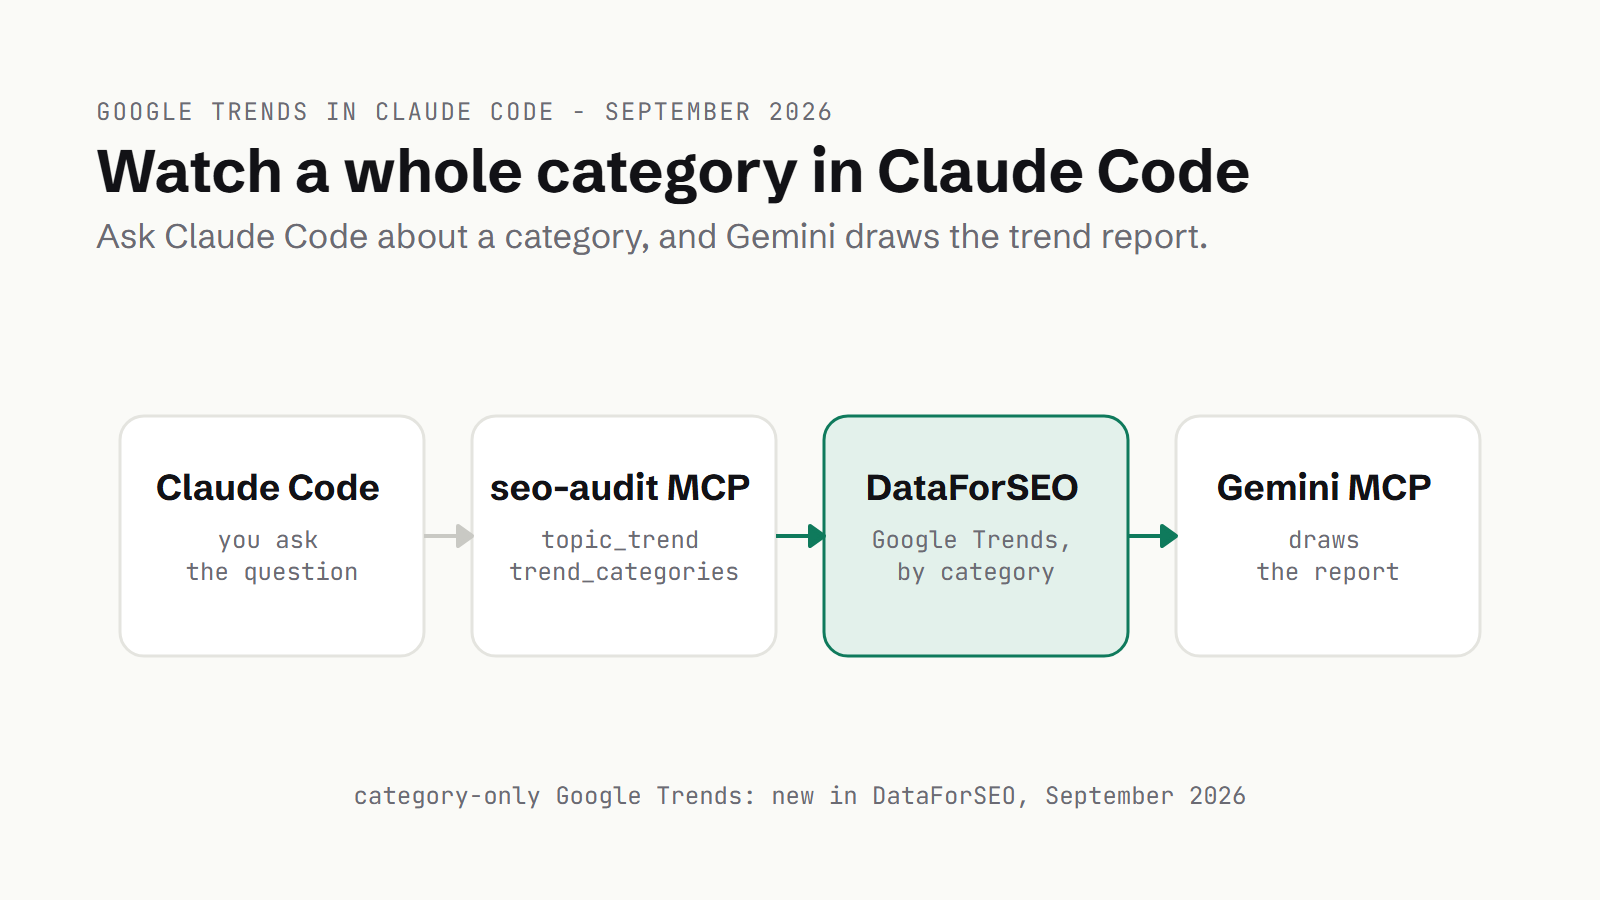
Google Trends can now be read by category, without a keyword. Search Engine Roundtable reported on 2 September 2026 that Google's Explore page now filters by category, "either with or without a query", and DataForSEO (a pay-as-you-go data API) followed in its Trends API later that month. On 29 September I added category support to my seo-audit MCP in version 0.10.0 (MCP is the plug-in standard that lets Claude call a tool), which means Claude Code can ask for interest in a whole market rather than one search term.
I'll set it up, then run the three ways of asking: a keyword on its own, a whole category with no keyword, and a keyword inside a category. At the end, Gemini MCP draws the report. Each call costs $0.011 through DataForSEO. My whole run of eleven calls came to about 12 cents, and looking up a category code is free. Category data turned out to be good at showing where a market is moving, but the rising queries need narrowing with a keyword and then checking before they're much use.
Quick Navigation
What you need before you start |
Is the Google Trends API free? |
Your first trend in one prompt |
Find the category code |
Watch a whole category |
Put a keyword inside a category |
See what's breaking out |
Have Gemini draw the report |
Gotchas |
Where to go from here
What you need before you start
You'll need Claude Code, Node 20 or newer, and a DataForSEO account. It's billed per request, and your API login and password are on the API access page of the DataForSEO dashboard. For the report step you'll also want a Gemini API key, which you can get from Google AI Studio.
The seo-audit MCP has Search Console tools too, but you don't need Search Console credentials for any of this. The Trends tools only need the two DataForSEO variables, and the server starts without the rest. On my own machine both servers run through Docker's MCP gateway, which runs each MCP server in its own container. The two commands below install the same servers the way their READMEs do, through npx (Node's package runner). Once they've run, restart Claude Code so it reads the new tool list, and do the same whenever you update the server.
claude mcp add seo-audit-console \
  --env DATAFORSEO_USERNAME=you@example.com \
  --env DATAFORSEO_PASSWORD=your-dataforseo-password \
  -- npx -y @houtini/seo-audit-console

claude mcp add -e GEMINI_API_KEY=your-api-key-here -s user gemini -- npx -y @houtini/gemini-mcp
If you don't have Claude Code yet, there's a free week of Claude Code to try it with.
Is the Google Trends API free?
It's the first question Google suggests under a search for a Trends API, and there are four routes, each in a different state as of September 2026.
| Route | Free? | State in September 2026 |
|---|---|---|
| Google's own Trends API | By application (alpha) | Announced in July 2025 as an alpha: consistently scaled data over a rolling five years, daily to yearly aggregation, regional breakdowns. Access is by application, and I couldn't find a general-availability announcement. |
| pytrends | Free | The unofficial Python library, archived on GitHub on 17 April 2025, so it's read-only now. |
| DataForSEO | No, paid per request | $0.011 an Explore request in my run, for up to five keywords. It has taken category-only requests since September 2026, and the seo-audit MCP caches responses, so asking the same question twice costs nothing. |
| The Google Trends website | Free | Still the answer for a one-off look. |
This setup is for when you want the data in the same Claude Code session as the rest of your work, and want to be able to run it again.
Your first trend in one prompt
Start with a keyword on its own. Ask Claude Code with the prompt below and it'll call topic_trend.
Is interest in "claude" rising or falling in the US over the last 12 months? Use topic_trend.It came back with 53 weekly points and a verdict: rising, from 19 to 61.
The numbers aren't search volumes. Google Trends reports relative interest from 0 to 100, where 100 is the peak of that particular request and everything else is scaled against it. A 0 means there wasn't enough data. The tool makes the rising, falling or flat call itself, by averaging the first and last quarter of the series: more than 10% up is rising, more than 10% down is falling, and anything in between is flat.
Find the category code
A Google Trends category is Google's own grouping of searches by subject, Books & Literature for example, and each one has a number. You need the number to ask for one. trend_categories searches all 1,427 of them by name, and it's free because DataForSEO doesn't charge for the list.
Find the Google Trends category codes for "marketing", "software" and "computer". Use trend_categories.Searching "marketing" turned up 25 Advertising & Marketing (under Business & Industrial), 83 Marketing Services, 84 Search Engine Optimization & Marketing and 328 Telemarketing. "software" gave me 32 Software, under Computers & Electronics, and "computer" gave the parent category, 5 Computers & Electronics, along with 728 Computer Servers and 309 Desktop Computers. With no query at all, you get the 25 top-level categories.
One thing to watch for: a category can sit under two parents. 84 appears under Advertising & Marketing and again under Web Services, and it's the same category either way, so you only need the number.
Watch a whole category
Since version 0.10.0, you can give topic_trend a category code and no keyword, and it returns interest in everything Google files under that category.
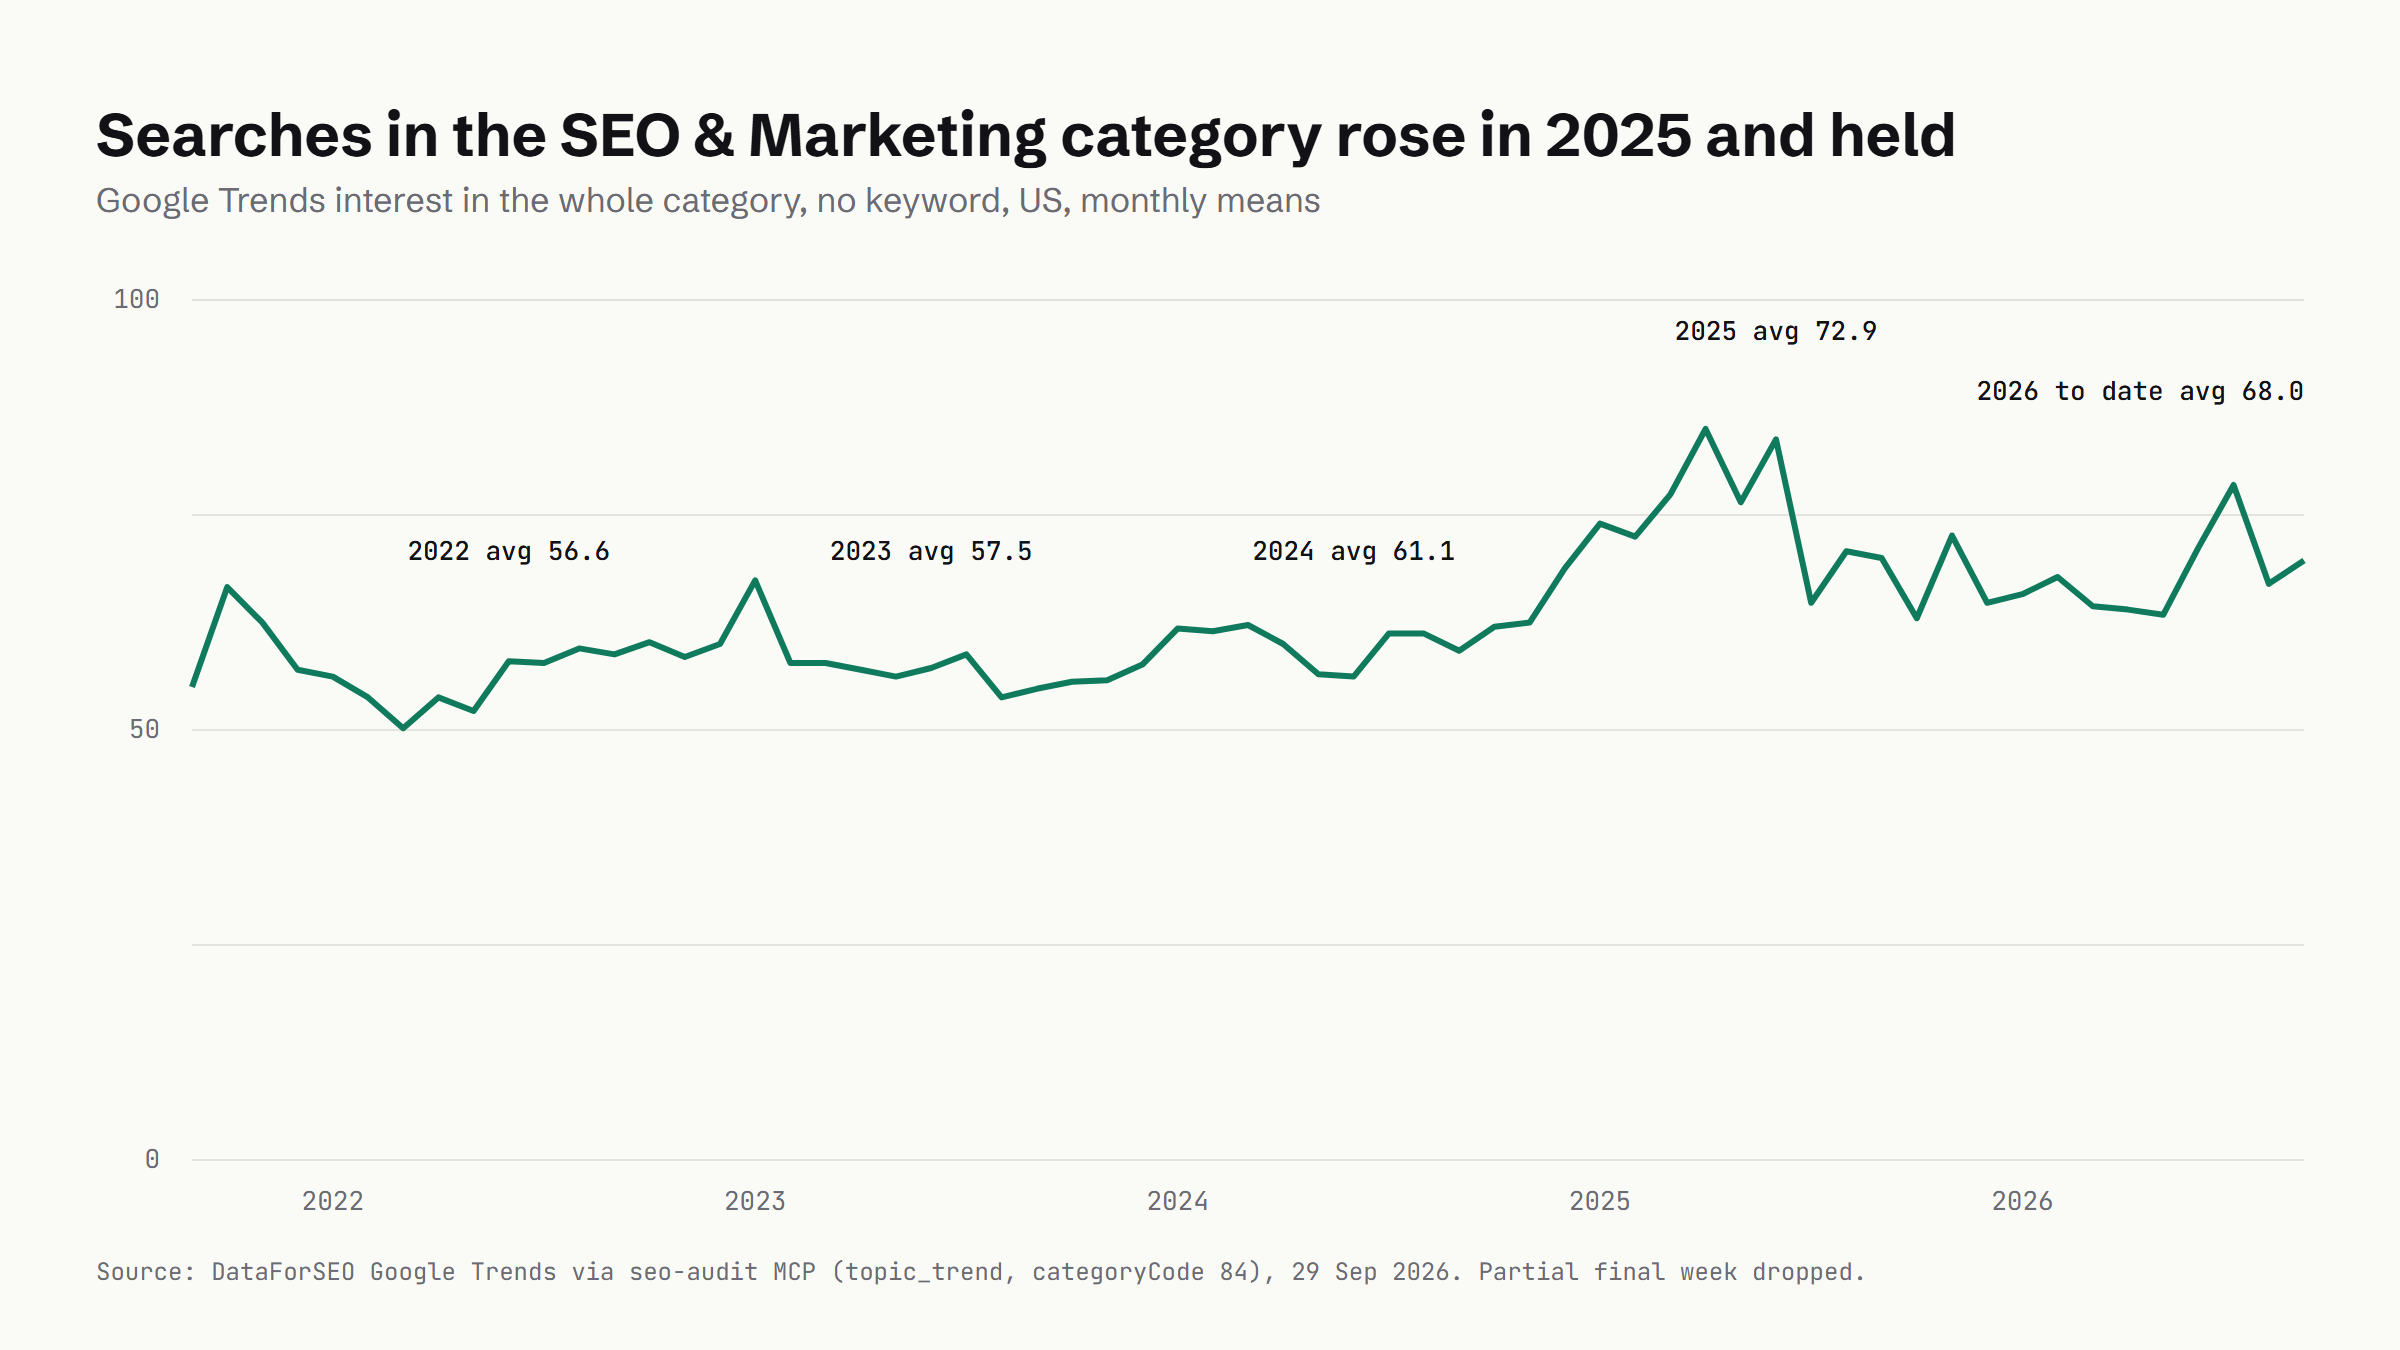
Show me Google Trends interest in the whole Search Engine Optimization & Marketing category (84), no keyword, US and UK, over the past five years.The US call came back rising. Averaged by year, the category sat at 56.6 in 2022 and 57.5 in 2023, rose to 61.1 in 2024 and jumped to 72.9 in 2025. 2026 so far is 68.0. The tool called the UK flat over the five years (63 to 64), but UK interest picked up this year: 63.5 in 2025 and 68.1 in 2026 to date.
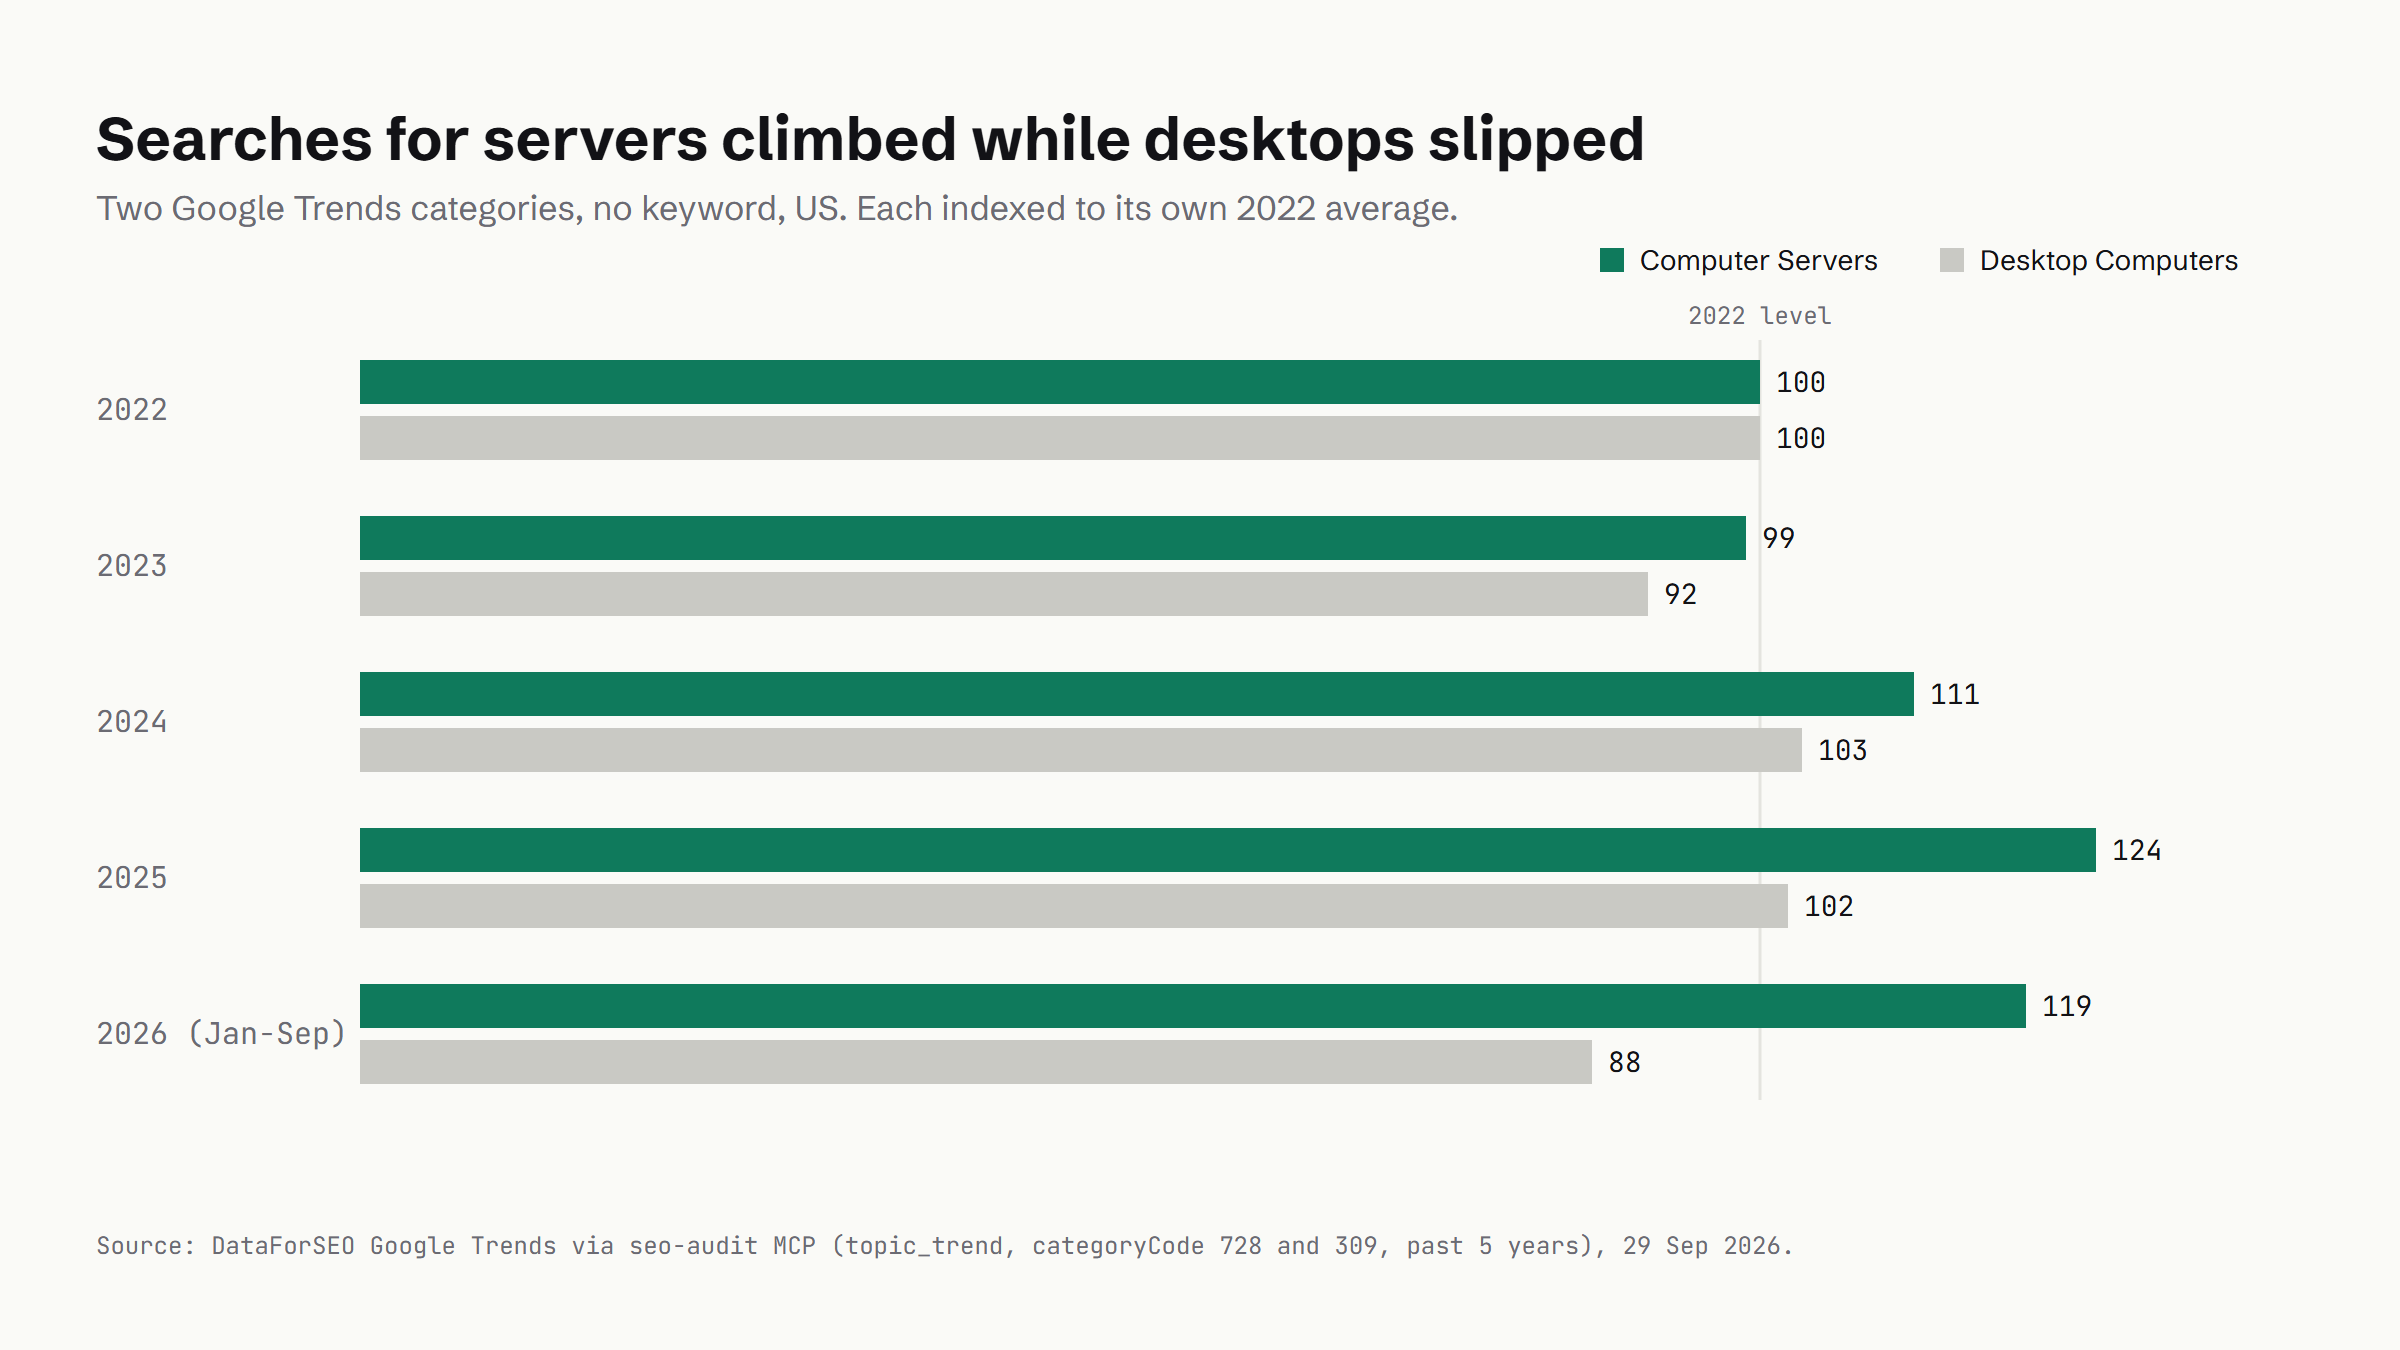
Comparing two categories takes an extra step, because each call is scaled to its own peak and a 70 in one call isn't the same as a 70 in another. The prompt below gets round that by indexing Computer Servers (728) and Desktop Computers (309), setting each one's 2022 average to 100.
Pull five years of Google Trends for Computer Servers (728) and Desktop Computers (309) in the US, then index each to its own 2022 average so they can be compared.Servers came out at 124 in 2025 and 119 so far in 2026, well above their 2022 level, while desktops managed 102 and then 88, which puts them back below theirs this year.
Put a keyword inside a category
Put a keyword and a category code in the same call and you narrow the term to one meaning. The word "claude" is a good test, because it's a first name as well as Anthropic's model.
Compare "claude" across all categories with "claude" inside the Software category (32), US, last 12 months.Both came back rising. In the week of 24 May 2026 the all-categories line hit 100, and the Software line went down that week, from 83 to 78, so the spike never showed up in Software. By August the all-categories line had faded into the high 50s, and Software was holding in the low 70s.
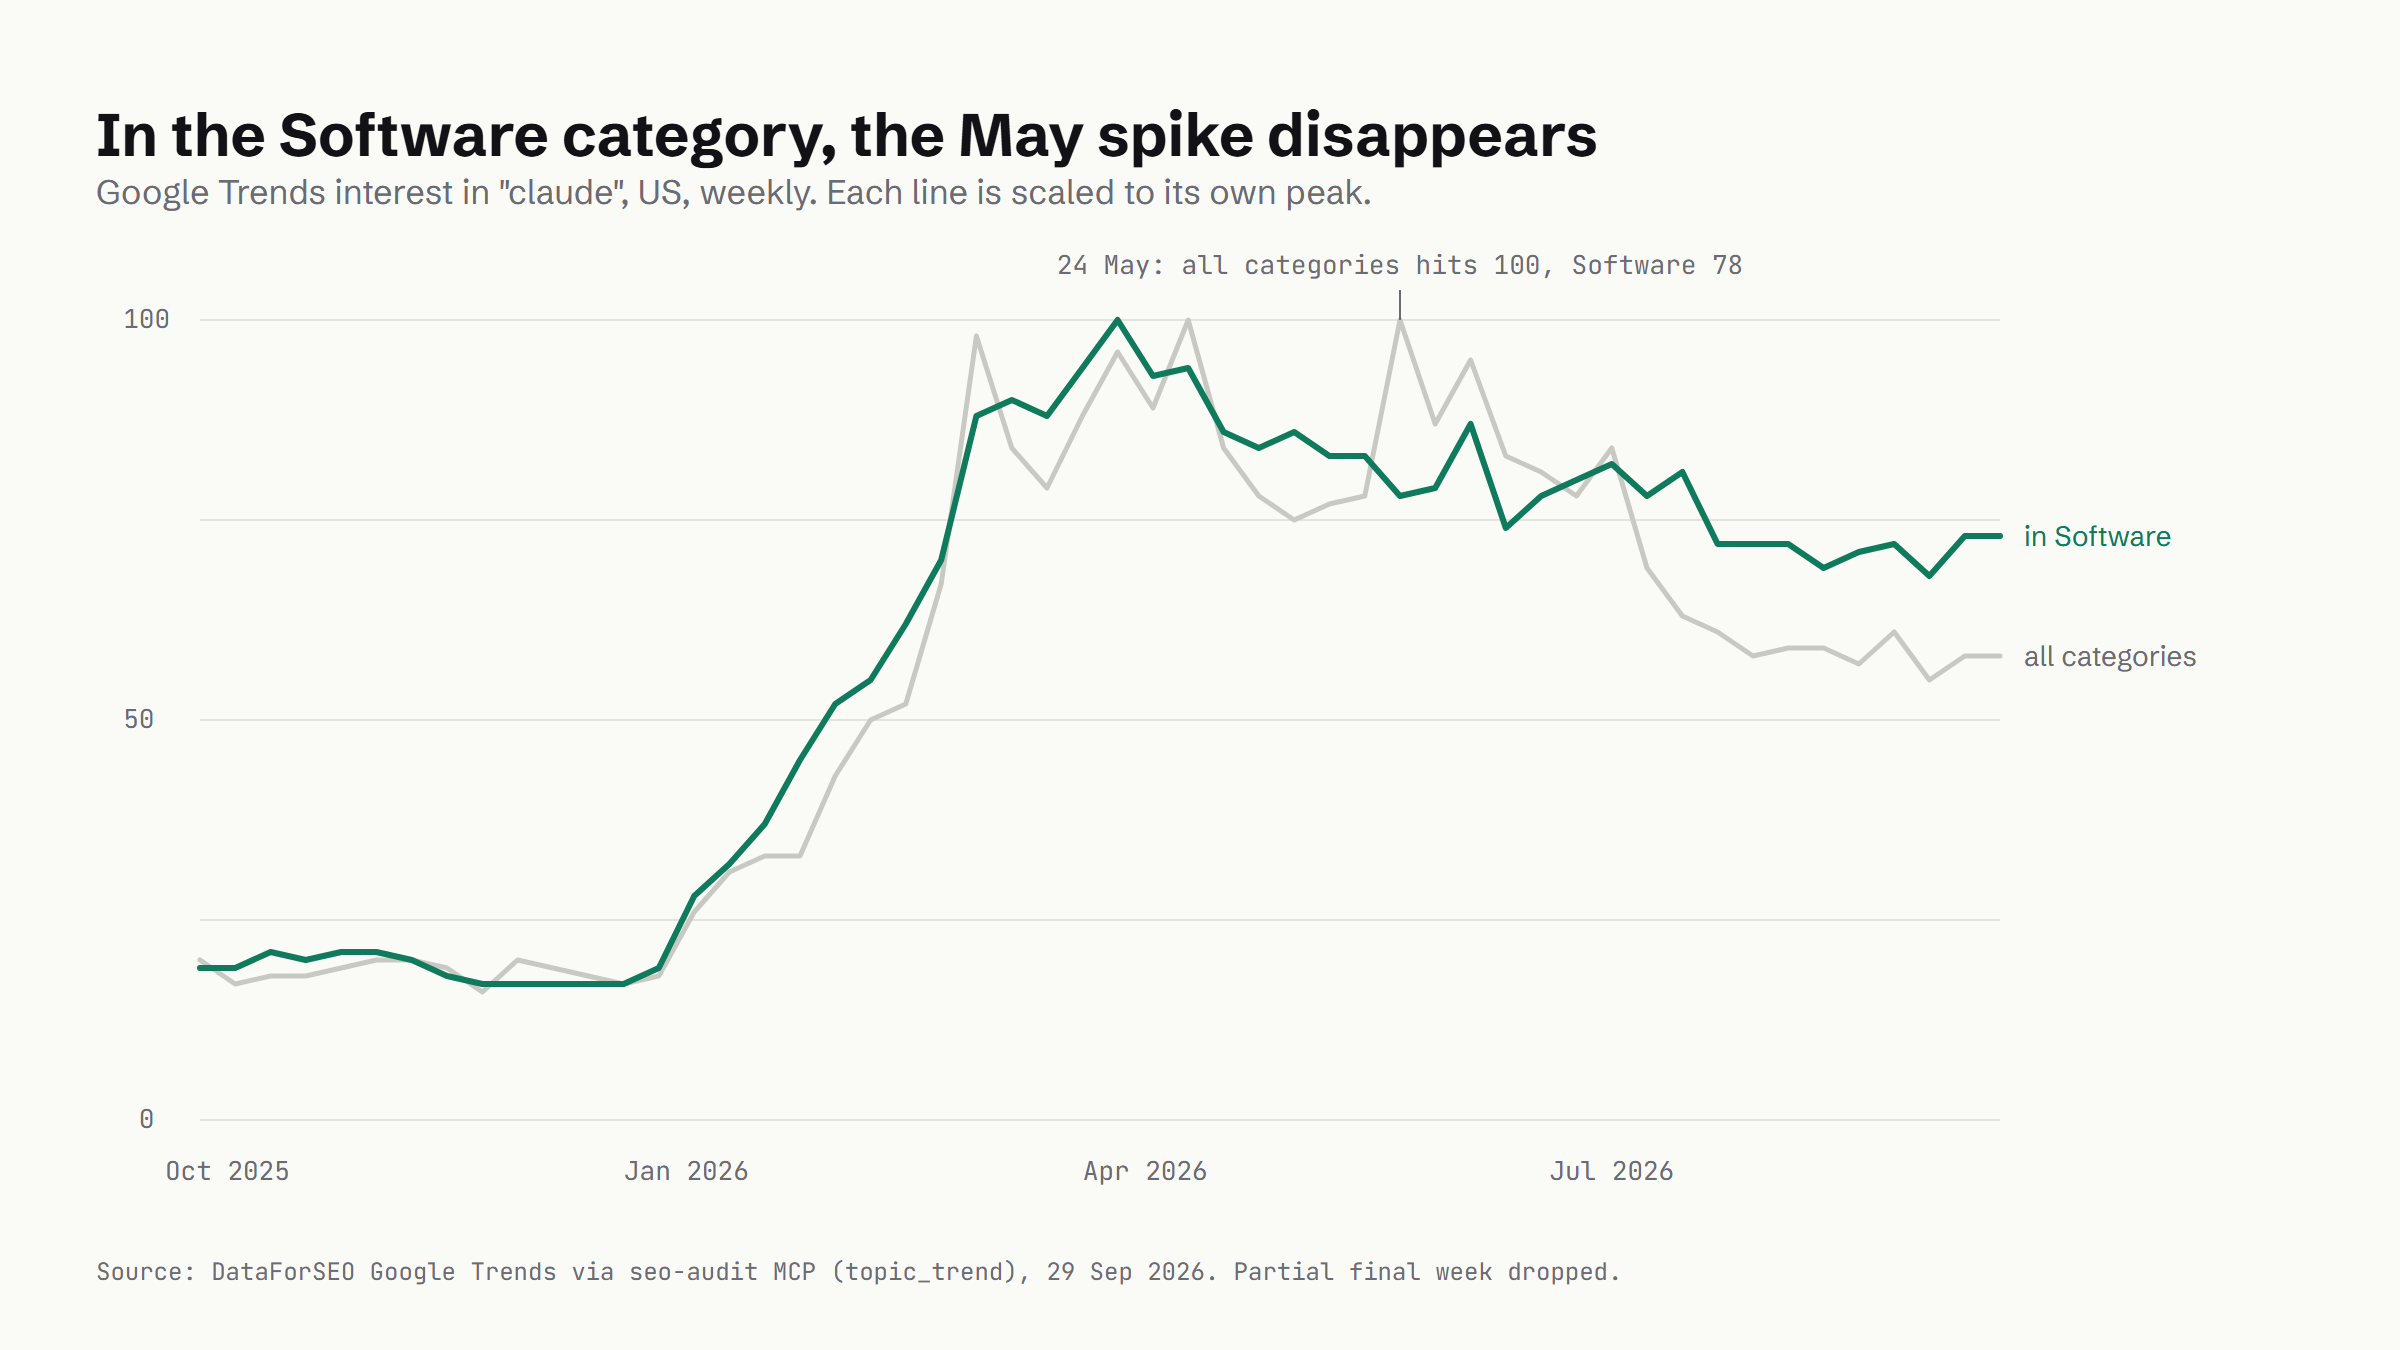
Searches for Claude in the software sense kept more of their peak than the bare keyword did.
See what's breaking out
Ask for related queries and topics and topic_trend returns top queries, rising queries and related topics alongside the line. It works with one keyword or none, not more. Top queries are ranked by relative popularity. A rising query's number is its percentage increase in search frequency since the previous period.
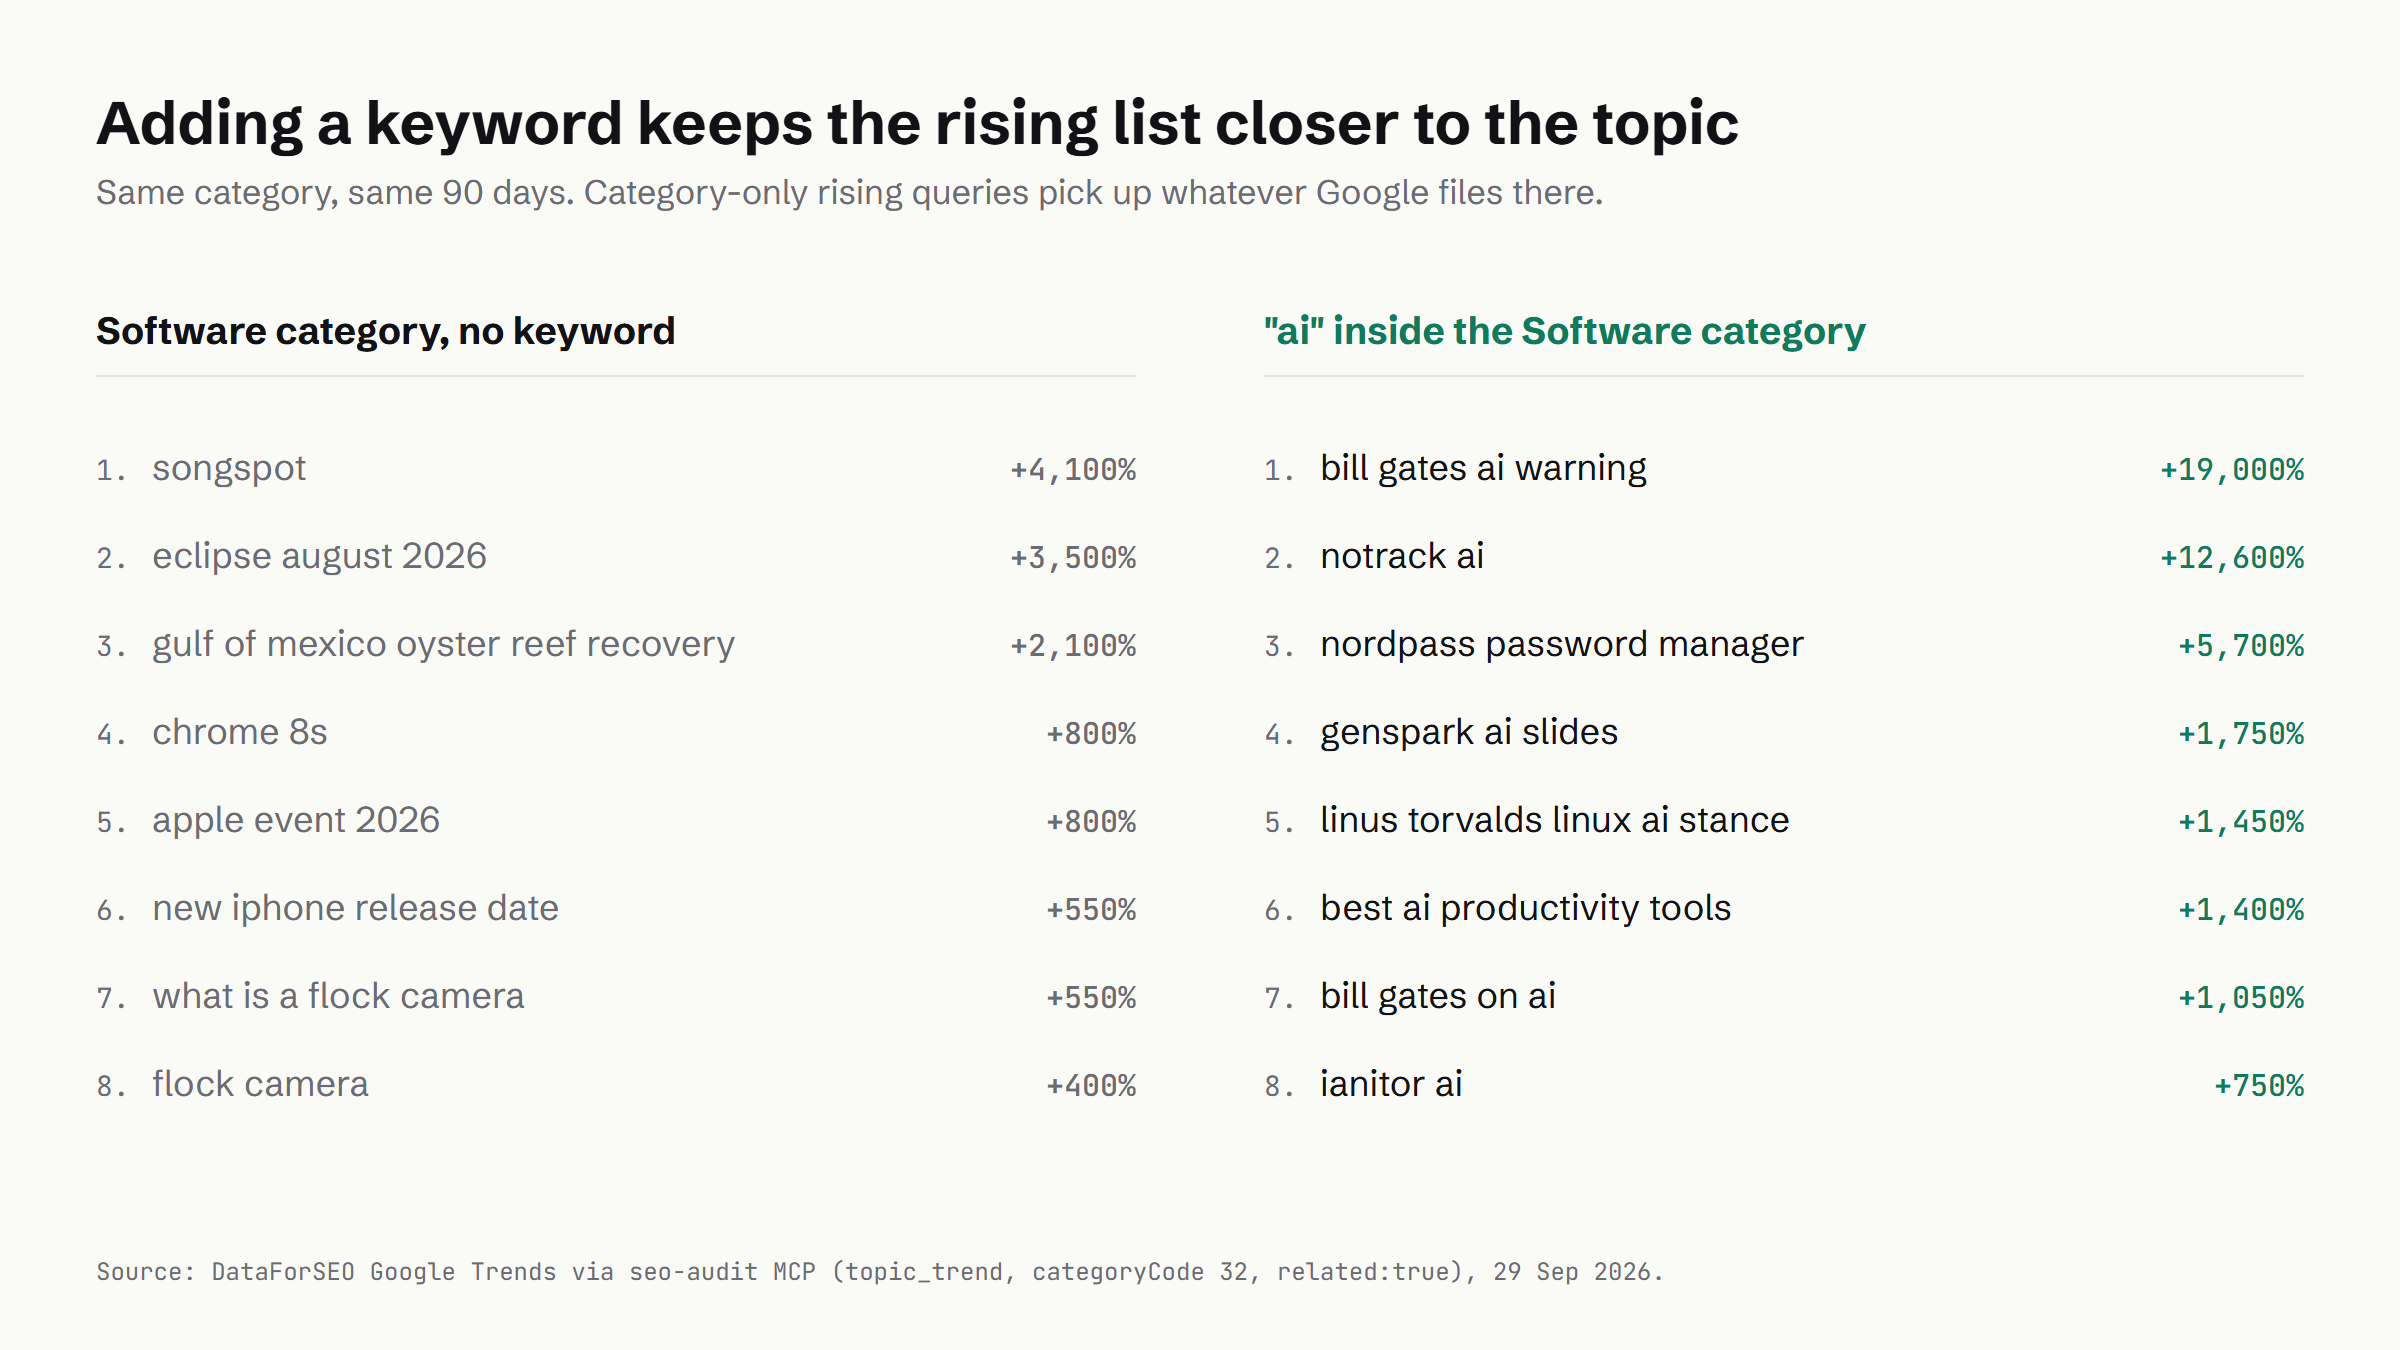
What's rising in the Software category (32) in the US over the last 90 days? Then run the same thing for "ai" inside Software, with related queries and topics.A rising list for a category on its own picks up whatever Google has filed there. For Software over 90 days in the US, that was songspot at +4,100%, eclipse august 2026 at +3,500% and gulf of mexico oyster reef recovery at +2,100%, and the last two are a long way from software.
Add "ai" inside Software and the list gets closer to the topic: genspark ai slides at +1,750%, best ai productivity tools at +1,400%. It still carries news spikes, though, such as bill gates ai warning at +19,000%. A password manager got in as well, nordpass at +5,700%.
Over 90 days the SEO & Marketing category's top query was "cancel" (100), ahead of "seo" (95), because Google files subscription cancellations there. Put "seo" inside the category and half of the eight rising queries are agency brand names, including best seo agency interamplify at +7,250% and seo agency regalseo at +1,100%, which looks like agencies pushing their own names up the list.
Have Gemini draw the report
Every result lands as JSON, and the last Claude Code prompt tidies it up before handing each finding to Gemini MCP's generate_svg.
Save every result as JSON in data/, drop the partial final week, and average the five-year series by month. Then ask Gemini's generate_svg for one chart per finding in our house style, giving it the exact values, and check every point it plots against the data file before you use it.Gemini drew every chart on this page in the Houtini house style, which fixes the hex colours and the two fonts, keeps to one accent colour, and prints the values and a source line on the chart.
Here are the Gemini prompts for the index chart and the five-year chart, the second with its 61 monthly values cut for length.
Draw a grouped horizontal bar chart as an SVG, 1200 x 675, in the Houtini house style.

Data: yearly average Google Trends interest for two whole categories (no keyword), United States, each indexed to its own 2022 average = 100. Use exactly these values:
2022: Computer Servers 100, Desktop Computers 100
2023: Computer Servers 99, Desktop Computers 92
2024: Computer Servers 111, Desktop Computers 103
2025: Computer Servers 124, Desktop Computers 102
2026 (Jan-Sep): Computer Servers 119, Desktop Computers 88

Style:
- Background #FAFAF7. One group per year, top to bottom 2022 to 2026, year label on the left in JetBrains Mono 15px #6B6B73. In each group two bars, 22px tall, 6px apart: Computer Servers first in Houtini green #0F7A5C, Desktop Computers second in #C9C9C4. 28px between groups.
- Bar length proportional to the value on one shared scale from 0 to 130 (so bar length divided by value is identical for every bar). A thin #E4E4DF vertical reference line at 100 labelled "2022 level" in JetBrains Mono 12px #6B6B73 at its top.
- Print each value at the end of its bar in JetBrains Mono 14px #121216.
- A small key at top right: a green square "Computer Servers", a grey square "Desktop Computers", Schibsted Grotesk 14px.
- Fonts: add <style>@import url('https://fonts.googleapis.com/css2?family=Schibsted+Grotesk:wght@400;700&family=JetBrains+Mono:wght@400;500&display=block');</style>.
- Top left, Schibsted Grotesk 700, 30px: "Searches for servers climbed while desktops slipped". Under it, 17px #6B6B73: "Two Google Trends categories, no keyword, US. Each indexed to its own 2022 average."
- Bottom left source line, JetBrains Mono 12px #6B6B73: "Source: DataForSEO Google Trends via seo-audit MCP (topic_trend, categoryCode 728 and 309, past 5 years), 29 Sep 2026."
- No gradients, no shadows, no 3D, no emoji. Every label inside the canvas with 48px margins.
Draw a line chart as an SVG, 1200 x 675, in the Houtini house style.
Data (monthly mean of Google Trends weekly interest, 0-100, category "Search Engine Optimization & Marketing", United States, Sep 2021 to Sep 2026). Plot every point exactly, in this order:
[61 monthly values, pasted by Claude Code from chart-data.json - "2021-09 55; 2021-10 66.6; ... 2026-09 69.7"]
Style:
- Background #FAFAF7. Text #121216. Secondary text and axis labels #6B6B73. Hairlines and gridlines #E4E4DF, 1px, horizontal only at 0, 25, 50, 75, 100.
- The line: Houtini green #0F7A5C, 3px, no markers, no smoothing, no area fill.
- Fonts: add <style>@import url('https://fonts.googleapis.com/css2?family=Schibsted+Grotesk:wght@400;700&family=JetBrains+Mono:wght@400;500&display=block');</style>. Words in "Schibsted Grotesk"; numbers, axis labels and the source line in "JetBrains Mono".
- Top left, in Schibsted Grotesk 700 at 30px: "Searches in the SEO & Marketing category rose in 2025 and held". Under it, 17px #6B6B73: "Google Trends interest in the whole category, no keyword, US, monthly means".
- X axis: a label at each January (2022, 2023, 2024, 2025, 2026) in JetBrains Mono 13px #6B6B73. Y axis labels 0, 50, 100 at the left.
- Annotate the yearly means as short labels above the line, JetBrains Mono 13px: 2022 avg 56.6, 2023 avg 57.5, 2024 avg 61.1, 2025 avg 72.9, 2026 to date avg 68.0. Place each over the middle of its year.
- Bottom left source line, JetBrains Mono 12px #6B6B73: "Source: DataForSEO Google Trends via seo-audit MCP (topic_trend, categoryCode 84), 29 Sep 2026. Partial final week dropped."
- No legend, no shadows, no gradients, no 3D, no emoji. Keep every label inside the canvas with 48px margins.Before any chart went on the page, Claude Code read the plotted coordinates back out of each SVG and compared them with the data file. The five-year chart matched on 61 of 61 points, the "claude" comparison on all 104, the breakout chart on all 16 labels and the index chart on all ten bars.
Last, Claude Code renders each SVG to PNG in headless Edge, which loads the house fonts that an SVG shown through an image tag can't.
Gotchas
Five of these came up on my run, and the sixth is a DataForSEO daily cap.
The last week reads low
The most recent point in a series can cover a partial week. My SEO & Marketing line dropped from 72 to 61 on the final point, which only covered 27-29 September. Drop any week under seven days before you chart it.
Separate calls aren't on the same scale
Every request is scaled to its own peak of 100. Compare the shapes, or index each series to a baseline of its own, as the servers and desktops chart does.
Category-only rising lists are noisy
Google files unrelated queries in a category: an eclipse, an oyster reef, football, subscription cancellations. Add a keyword inside the category to pull the list back towards your topic.
Marketing rising lists get gamed
In both SEO category runs, agency brand names turned up among the rising queries, and regalseo was in both. Check a rising query before you build anything on it.
Claude Code keeps an MCP's old tool list
After I updated the seo-audit MCP, Claude Code picked up the new trend_categories tool straight away but kept showing topic_trend without categoryCode, because it had cached the tool list from before the update. Restart Claude Code, or reconnect the server with /mcp, after any update.
There's a shared daily cap
DataForSEO limits Google Trends to 500,000 requests a day across all of its users, and asks you to spread big jobs out. My eleven calls were nowhere near it.
Where to go from here
Look up your own market's category code and run the whole-category prompt on it over five years. At a cent a call, it's a cheap way to see whether interest in your subject is growing or shrinking.
The seo-audit MCP's tool page has the full tool list, and there's a page for Gemini MCP as well. For more MCP servers for SEO and content work, there's my roundup of the best MCPs for content marketing. And if you'd rather use DataForSEO's own MCP server than mine, I've written up how to set that up too.
Continue reading.
- How-to GuidesCLAUDE.md: How to Write One That Stays Lean
- How-to GuidesHow to Make a PDF Report with Claude
- How-to GuidesHow to Make a Presentation with Claude
- How-to GuidesHow to Benchmark vLLM: Find the Best Model, Quant and Settings for Your GPU
- How-to GuidesClaude Code Memory: How to Keep It Useful
- How-to GuidesHow to set up an MCP gateway with Docker