vLLM settings for a pair of RTX 4090s: the flags I run for twelve local models, and why
The flag-by-flag vLLM settings page for a dual-4090 rig: the baseline every preset shares, the six flags that change per model, the rig discipline you set once, and one verified launch block for each of twelve open-weight models with the reason attached.
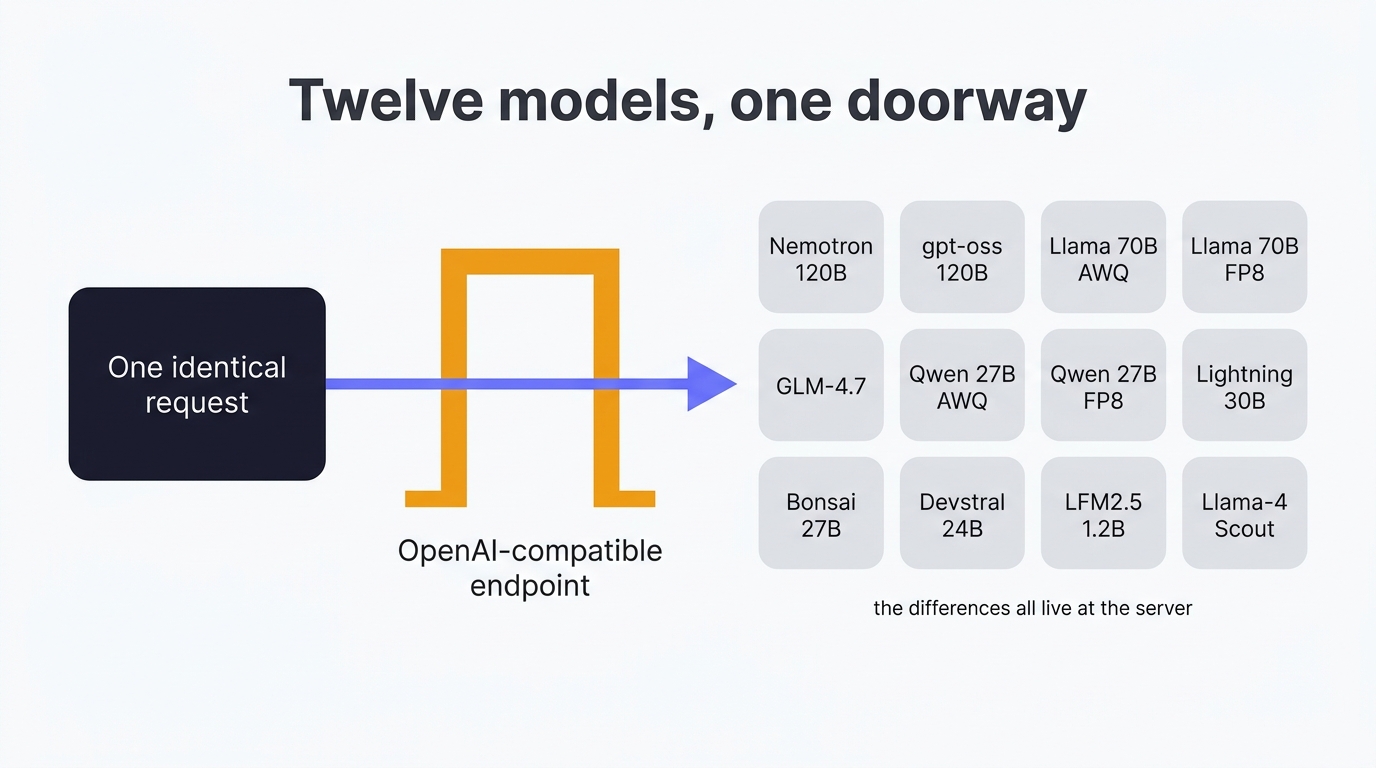
No two open source LLMs are the same. During my research I've discovered just how different, in setup and api request / response, they can be. So if you're swapping models with expectations of performance, only to be disappointed, read this rather than spending a whole night trying to get your head around what's going on.
This is the settings page for my dual-4090 rig: the flags every preset shares, the handful that change from model to model, the rig discipline you set once, and then one verified launch block for each of twelve open-weight models with the part the flags don't explain, which is what tripped me up and how I got it running. The numbers don't live here. The measured runs sit on the model testing page and the benchmark runbook , the compose file and the WSL2 walls are in the set-up guide , and this page tells you what to type.
Where the flags came from shaped the page, so I'll say it plainly. I built the rig for tensor parallelism, having two cards and a feeling I was leaving performance on the table, and I got the basic shape serving myself. The settings below were then found by a test harness Claude wrote, which iterated for about three days across models, quant formats, power limits and tensor parallel on and off, one change per run, and logged every result next to the flags that produced it. Learning vLLM is like the old days of running your own servers: you start from someone's recommended settings or the official guide and tune from there, and this page is meant to be the something you start from.
Quick Navigation
Where the settings live
The shared flags
The per-model flags
Rig discipline
The twelve models
The three I couldn't serve
Where to go from here
Where the settings live
"OpenAI-compatible" describes the doorway, not the room. It tells you the URL and the JSON shape, and that part is useful - one client talks to all twelve models. But whether a model runs, and runs right, is decided somewhere else: in the settings you hand the server when you launch it, per model.
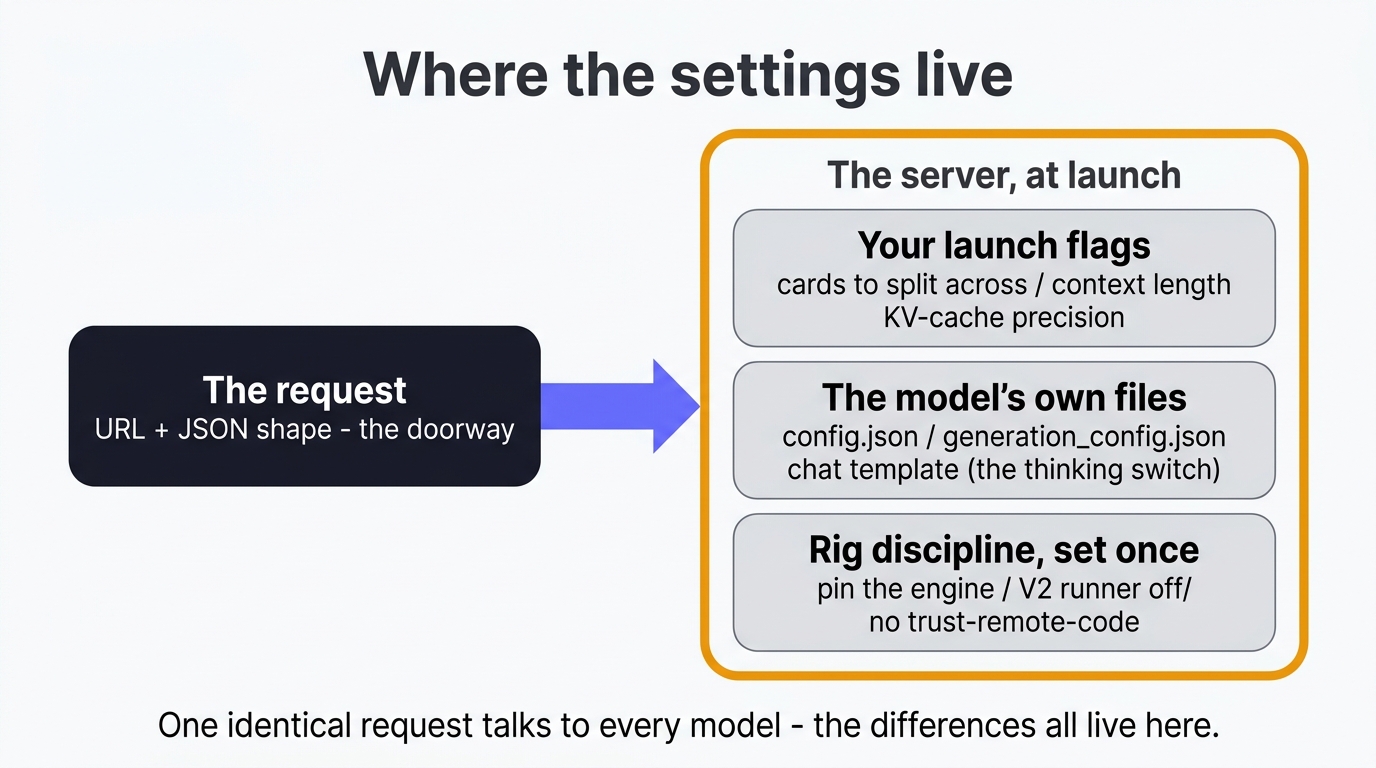
Those settings come from three places, and only the first one feels like configuration. Your launch flags are the obvious ones - how many cards to split across, how much context to allow, the KV-cache precision, how hard to fill the VRAM. The model's own files are the sneaky ones: config.json holds the architecture, generation_config.json holds the vendor's recommended sampling, and vLLM reads that file by default - so if your client sets temperature, you're quietly overriding the people who trained the model. And the chat template, a Jinja file, is where the switch for turning reasoning on and off lives, which is why that switch is named something different on nearly every model. Then there's the rig discipline you set once and forget, which gets its own section below.
The per-model differences belong in the server launch, never in your client. Get that right and a single identical request talks to everything. Get it wrong and you're comparing harnesses while you think you're comparing models - and you won't spot it, because the request still looks completely standard.
The flags every preset shares
Every preset on the rig carries this line, and it hasn't regressed a single model since the July validation:
--enable-auto-tool-choice --tool-call-parser <family> --reasoning-parser <family>
--enable-prefix-caching --max-num-batched-tokens 8192 --max-num-seqs 16
--gpu-memory-utilization 0.92 --kv-cache-dtype fp8
Flag by flag, with the reason and, where the serve reference states one, the default you'd get by leaving it out.
The parsers, or tool calls leak into the prose
Every model family speaks its own tool-call dialect and its own reasoning markup, and --tool-call-parser with --reasoning-parser name the translators that turn them into the OpenAI schema. Leave the tool parser off and the call arrives as raw XML in the message; leave the reasoning parser off and the chain-of-thought lands in content, inflating every token count. --enable-auto-tool-choice is the switch that lets the model decide when to call a tool at all, and it defaults to off, so a parser on its own does nothing. The family names I use: qwen3_xml and qwen3 for Qwen, gemma4 for Gemma, nemotron_v3 for Nemotron 3, hermes for the JSON-dialect families, lfm2 for Liquid's models. The docs' list of parsers lags the image, so if a name isn't on the page, pass a deliberately wrong one and the engine fails with a KeyError listing every parser it has.
Prefix caching is the orchestration flag
--enable-prefix-caching lets the engine skip prefill for any prompt prefix it has already seen, and orchestrated calls repeat the same system prompt and tool definitions on every request. On a repeated 16k-token prompt the time to first token went from 3.92 seconds to 0.08 on the small coder, 8.76 to 0.07 on the vision model. The catch is that "already seen" means byte-identical, and that's a client-side responsibility: put a timestamp in your system prompt and you've silently switched the cache off. That rule is written into houtini-lm's docs because I did exactly that.
max-num-seqs 16: the reservation nobody mentions
--max-num-seqs is how many sequences the engine will run in one scheduling step, and every reserved slot multiplies the KV cache it sets aside; the docs say the default "is mainly for convenience when testing", which is a polite way of saying it's sized for a serving cluster. I never run more than four requests in parallel. Cutting the reservation to 16 freed gigabytes of VRAM for context instead. The llama.cpp crowd found the same thing independently - a widely shared post about fitting 150k context on a 12GB card turns out to hinge on -np 1, that ecosystem's version of the same flag.
max-num-batched-tokens 8192, and the number that deadlocked
--max-num-batched-tokens caps the tokens in one iteration, which is the chunk size for a long prefill, and 8192 keeps Ada saturated without drama. I tried 16384 and it was strictly worse: prefill measured 1715 tokens per second (tok/s) against 2002 at 8192, and on a preset with speculative decoding it wedged the engine on a 16k cold prefill while /health carried on returning 200. The 35B mixture-of-experts runs 16384 without complaint because it has no draft head; everything else stays at 8192.
gpu-memory-utilization 0.92 is the default, and it measures the setting
--gpu-memory-utilization is the fraction of each card the engine claims for weights plus preallocated KV cache, and 0.92 is what the docs give you if you leave it out. Two things follow that catch people. Serving VRAM reads about 45GB per card for every model regardless of size, because the engine fills to the target by design, so nvidia-smi measures the flag, not the model. And it's a per-instance limit, so two vLLM instances on one card have to sum below 1.0 or the second one won't start.
kv-cache-dtype fp8 halves what the context cache eats
The KV cache is the model's working memory for your prompt, it competes with the weights for VRAM, and storing it at 8-bit is how a 27B runs 131k context on a single 48GB card. The docs' default is auto, which follows the model's own precision. Two of my presets deliberately keep auto: the Gemma daily driver, because I want bf16 cache accuracy on code and it fits at 131k, and GLM-4.7-Flash, for a kernel reason in its own section below.
The flags that change per model
Six things vary from preset to preset. Everything else on the rig is the block above.
max-model-len: cap it, or the engine sizes a cache you'll never use
Leave --max-model-len out and vLLM derives it from the model config, which is the native window, and then reserves KV cache for it. On Llama-4-Scout that's 10,485,760 tokens. The number I set is the context a human needs, 32,768 for most of the fleet, and the one measured exception is Llama-3.3-70B in AWQ on a single card, which serves up to 21,110 tokens and not its advertised 131,072, because 39.8GB of weights leaves about 4GB for cache. That isn't a bug, it's arithmetic nobody prints on the box, and the VRAM traps do the arithmetic properly. The flag takes 32k shorthand if you'd rather.
tensor-parallel-size: 1 or 2, and 2 more often than the doctrine says
--tensor-parallel-size 2 splits each layer across both cards. The obvious use is a model that won't fit one card. The less obvious use is a model that will: on Qwen3.8-27B at long context, single stream, one card decoded at 34.4 tok/s and two at 48.9, a 42.2% gain, because two cards' worth of memory bandwidth beats the all-reduce tax over my x4 link. Pipeline parallelism, the arrangement the doctrine would prefer, came in at 32.9, slower than not splitting. Scope: one model, one context, single stream; I'd re-measure under concurrency before moving production. Every TP=2 preset also carries --disable-custom-all-reduce (fall back to NCCL, because the custom kernel assumes NVLink) with NCCL_P2P_DISABLE=1 in the environment, because peer-to-peer transfers hang on consumer boards, and the Nemotron 120B adds --enable-expert-parallel, which the docs describe as expert parallelism instead of tensor parallelism for the MoE layers.
The thinking switch has three names and no error
Reasoning models think before they answer, and for delegated work that thinking is pure latency: 0.8 seconds with it off against 3.7 with it on for the same tool call. The switch lives in the chat template, so the key changes per family. Qwen, Nemotron 3 and GLM take enable_thinking; gpt-oss and Liquid's LFM2.5 take thinking; Llama and Devstral have no thinking mode and take nothing. An unknown key in chat_template_kwargs is silently ignored, so the wrong name means the model reasons anyway and you find out from the latency. Nemotron's documented "detailed thinking off" system prompt is the version 2 mechanism; version 3 ignores it.
Multimodal limits: text-only is one flag away
A model that crashes during vision profiling can still serve text. --limit-mm-per-prompt.image 0 zeroes one modality; the docs now carry --language-model-only, which zeroes all of them in one flag. My vision preset runs the other way, --limit-mm-per-prompt.image 4, because four screenshots per prompt is what UI testing needs.
Speculative decoding: off, until upstream fixes it
--speculative-config '{"method": "mtp", "num_speculative_tokens": 2}' (a small draft head guesses the next couple of tokens; the full model verifies them in one pass) is worth about a third of a dense 27B's decode, 47 tok/s to 63 in a same-day A/B. It's off on every production preset anyway, because on 0.26.0 it can wedge the engine on a long cold prefill while the health endpoint keeps saying fine, and a server other things depend on doesn't get to trade availability for speed. I retest it on each new stable.
Sampling: none, and that's the setting
--generation-config defaults to auto, which loads the vendor's generation_config.json and applies its sampling on every request, and I leave it there. Qwen and Nemotron say temperature 1.0; Llama says 0.6 with top_p 0.9; Devstral, gpt-oss and LFM2.5 declare nothing, so vLLM's defaults apply to those and you should know which you're getting. Never set sampling from the client. My orchestrator once pinned Qwen to 0.2 under a comment claiming the value was vendor-documented, and an evening of measurements went in the bin.
Rig discipline set once
None of these is a per-model flag, and each one cost me more than most of the flags did.
- Pin the engine by digest.
image: vllm/vllm-openai:latestmoved the fleet from 0.25.1 to 0.26.0 on a routine model swap in August, and a week of benchmarks became comparable to nothing. The.envnow carriesVLLM_IMAGE=vllm/vllm-openai@sha256:...and version changes are a dated event with their own sweep. VLLM_USE_V2_MODEL_RUNNER=0. vLLM's newer model runner wants unified virtual addressing and under Docker Desktop dies withUVA is not available. Every preset here runs the V1 path. The environment-variable reference has since gainedVLLM_WSL2_ENABLE_PIN_MEMORY=1for exactly this case; I haven't tested it, so V1 is the setting I can vouch for.- Keep the weights in a Docker volume, not a Windows folder. A bind mount arrives inside the container as 9P, a network filesystem, and the same model loaded in 763 seconds from the bind mount against 203 from an ext4 volume, reproduced to the second.
--safetensors-load-strategy=prefetchclaws back about a quarter on 9P and never switches on by itself there, but moving the weights wins by a distance. - Set
HF_TOKEN. Anonymous Hugging Face pulls hit a rate limit that drops the loader into a silent backoff; the token removed it and measured five times the download speed. It lives in.env, never in a preset. - Never
--trust-remote-code. The flag lets a downloaded model run its own Python. A model that appears to need it deserves a second look before you throw it away, and the Nemotron section below is the worked example. - Cap the power and lock the clocks, then make it survive a reboot. Both cards run a 330W cap with the core clock locked to 2200MHz, and across three power-and-clock conditions decode never moved while the unlocked clocks drew about 90W more.
nvidia-smi -plis volatile: every reboot resets it, so a 2am Windows Update quietly invalidates a week of measurements. An elevated at-logon Task Scheduler job reapplies it, and the bench script checks the limit before recording anything. - max_tokens is a brake, not a throttle. Thinking models spend 100 to 800 tokens reasoning before any visible output, all charged against max_tokens, so a 200-token cap returns HTTP 200 with empty content and no error. Unused budget costs nothing. I use 8k for tool execution and 32k where generation or thinking is involved, and I cap any model I haven't watched self-terminate.
- Host settings. Hardware-accelerated GPU scheduling off, and in
.wslconfig: processors set to the P-core count,swap=0so an over-budget model fails instead of paging,networkingMode=mirrored. That batch measured about 7% on decode in July.
Twelve models, one launch block each
Each block is the configuration the campaign verified on this rig, vLLM 0.26.0 pinned by digest, with the shared line from above added at launch. Load times are from the Windows bind mount, so divide by roughly 3.75 for the volume. The runbook page has the dataset behind every number and a fit calculator for your own card.
Nemotron-3-Super-120B: the model that ships code it never runs
# NVIDIA-Nemotron-3-Super-120B-A12B-AWQ-4bit, 80.7GB of weights, both cards
--tensor-parallel-size 2 --enable-expert-parallel --disable-custom-all-reduce
--max-model-len 32768 --kv-cache-dtype fp8 --gpu-memory-utilization 0.92
--reasoning-parser nemotron_v3
# env: NCCL_P2P_DISABLE=1   # loaded in 1816s from the bind mount
This 120B looks like it needs --trust-remote-code, and it doesn't. It ships four .py files with an auto_map in config.json pointing at them, which is the usual sign a model wants to run its own code, and I was wary enough to write a fleet audit that rejects any model with an auto_map. It flagged this one as unsafe while it was loading perfectly, four shards from done, with no --trust-remote-code set. vLLM has NemotronHForCausalLM in its own registry and runs the model with its own code; the .py files just sit there. Shipping code and running code aren't the same thing, and my audit was checking the wrong one, so I changed it to a warning that asks the right question: does it serve without the flag? If it does, nothing ran. The other trap in this family is thinking: the "detailed thinking off" system prompt is Nemotron 2's, version 3 ignores it silently, so you pass enable_thinking: false through chat_template_kwargs and set the parser to nemotron_v3, not v2, or it won't start. Once up, it barely slows as the context fills, which is unusual for a model this size.
gpt-oss-120b: the 120B that fit, and the one that lied about it
# openai/gpt-oss-120b (official, native MXFP4), 65.2GB of weights, both cards
--tensor-parallel-size 2 --disable-custom-all-reduce
--max-model-len 131072 --kv-cache-dtype fp8 --gpu-memory-utilization 0.92
# env: NCCL_P2P_DISABLE=1   # loaded in 1334s; ~92.7GB serving at full context
The config is boring, and that's the headline. A 117-billion-parameter model, shipped in MXFP4, loads across both cards at its full 131k context in about 92.7GB and holds 153 tok/s. For weeks my own notes said MXFP4 gets upconverted to full precision on Ada, which would mean around 234GB of weights and no chance of fitting 96GB. It fit, so the weights stayed 4-bit in memory whatever the kernel does with them at compute time, and a rule I'd carried for six weeks died in one load. The part that will bite you is the version I tried first: a community "4-bit" AWQ conversion that ran out of memory on load, which makes no sense for something meant to be quantised. The metadata showed the MoE experts, the bulk of the model, were never quantised at all. F16, every one. A quant's name is a claim and the file is the truth, and it costs nothing to check which before an hour's download. I ran this one text-only for the sweep; the docs list an openai tool parser for the family that I haven't wired yet.
The two Llama-3.3-70Bs: same model, one file, two different contracts
# Llama-3.3-70B-AWQ (casperhansen), 39.8GB - fits ONE card, but not at full context
--tensor-parallel-size 1 --max-model-len 21110 --kv-cache-dtype fp8 --gpu-memory-utilization 0.92
--tool-call-parser llama3_json   # docs-recommended; no reasoning parser, this family doesn't think
# loaded in 940s

# Llama-3.3-70B-FP8, 72.7GB - needs both cards
--tensor-parallel-size 2 --disable-custom-all-reduce
--max-model-len 32768 --kv-cache-dtype fp8 --gpu-memory-utilization 0.92
# env: NCCL_P2P_DISABLE=1   # loaded in 1536s
Take the AWQ build first, because the number in that first line is the whole VRAM-traps story in one figure: 39.8GB of weights slides onto a single 48GB card with room to spare, and then won't serve its advertised 131,072 context, because the KV cache is the other half of what has to fit. It tops out at 21,110 tokens on one card, measured. Then the FP8 build caught me out. It's 72.7GB, so it needs both cards and loads about two-thirds slower, fair enough for the bigger file. What you would not expect is that the FP8 build's chat template doesn't handle tools and the AWQ build's does. Same model, same maker, same weights underneath, and whether you can call functions comes down to which quantisation someone uploaded. I keep both and keep them straight: AWQ when you want tools and a single card's context is enough, FP8 across both cards when you want the longer window and don't. Check tool support per build, not per model.
GLM-4.7-Flash: the kilobyte in the wrong memory
# GLM-4.7-Flash-GPTQ, 16.6GB, one card
--tensor-parallel-size 1 --max-model-len 32768 --gpu-memory-utilization 0.92
--kv-cache-dtype auto   # NOT fp8 - that single word is the fix
# loaded in 441s
Every other model here runs an fp8 KV cache and this one, alone, does not. A 16.6GB model refused to load on a 48GB card, short by one kilobyte of shared memory - the scratchpad inside each SM, nothing to do with VRAM, 101,376 bytes on Ada - because the fp8 KV-cache kernel was tuned for a bigger card. --kv-cache-dtype auto picks a different kernel entirely, and it loaded and behaved. One word in one flag, and the day it caught me I lost the best part of an evening, which is why the comment is loud. The docs list a glm47 tool parser for this family; the sweep ran it without one.
The two Qwen3.8-27Bs: the temperature that binned an evening
# Qwen3.8-27B-AWQ (27.7GB) and Qwen3.8-27B-FP8 (30.9GB), one card each
--tensor-parallel-size 1 --max-model-len 32768 --kv-cache-dtype fp8 --gpu-memory-utilization 0.92
--reasoning-parser qwen3 --tool-call-parser qwen3_xml
# loaded in 1470s (AWQ) / 1522s (FP8); speculative decoding deliberately off
Qwen ships a generation_config.json with the sampling the people who trained the model recommend, temperature 1.0 for this family with top_p 0.95 and top_k 20, and Qwen explicitly warn against low-temperature decoding because of how they post-trained it. That feels wrong after years of being told to run cold for deterministic answers, and it isn't. My harness pinned Qwen to 0.2 under a tidy comment claiming that was "vendor-documented", a client that sets temperature overrides the file on every request without a sound, and I ran a whole evening off-distribution before I noticed. The second thing is the comparison, which comes out the counter-intuitive way round: the FP8 build is the slightly bigger file and decodes at about half the speed, 16.6 tok/s where the AWQ manages 35.8, because decode is bytes-touched-per-token and four-bit weights touch fewer of them. If you only take one Qwen, take the AWQ.
Nemotron-3.5-Lightning-30B: the one that doesn't slow down
# Nemotron-3.5-Lightning-30B-FP8, 32.3GB, one card
--tensor-parallel-size 1 --max-model-len 32768 --kv-cache-dtype fp8 --gpu-memory-utilization 0.92
--reasoning-parser nemotron_v3
# loaded in 1002s
This is the fastest thing in the fleet at 158 tok/s at short context, and the reason I keep coming back to it is what happens as the context fills up, which on most models is where the speed drains away. It barely moves. That's the Mamba2 hybrid architecture doing what it's built for, and for anything long-document it's the most interesting model on the rig. Configuration-wise it's a well-behaved member of the Nemotron family: nemotron_v3 for the parser, the thinking toggle through the chat-template kwarg, no --trust-remote-code. If you've set up the 120B you already know this one.
Ternary-Bonsai-27B: the featherweight
# Ternary-Bonsai-27B-AWQ, 18.7GB, one card
--tensor-parallel-size 1 --max-model-len 32768 --kv-cache-dtype fp8 --gpu-memory-utilization 0.92
# loaded in 608s
Not every model on this rig put up a fight. This is a 27B that lands at 18.7GB, lighter than several models half its size, and it's the same Qwen3_5 architecture class as the pair above, so it configures the same way and needs nothing special. I've kept it in because a page that only showed the models that fought back would leave you braced for trouble that mostly isn't there: once you know a family's habits, most models in it just come up. This one came up first time.
Devstral-Small-24B: the coding model that behaved
# Devstral-Small-2-24B-AWQ, 32.1GB, one card
--tensor-parallel-size 1 --max-model-len 32768 --kv-cache-dtype fp8 --gpu-memory-utilization 0.92
# loaded in 699s; add --language-model-only if the vision profiler ever crashes
Devstral is a coding model on a Mistral multimodal architecture, and it's the other one I can be brief about because it loaded and got on with it. It has no thinking mode and declares no vendor sampling, so vLLM's defaults apply, and a comparison against a model that ships temperature 1.0 is a comparison of two samplers as much as two models. The one flag to keep in your pocket for any multimodal model is the text-only fallback above; I didn't need it here, and it's saved a couple of the others.
LFM2.5-1.2B: a small model with surprisingly big tokens
# LFM2.5-1.2B-Instruct, 2.3GB, one card - and check your context maths
--tensor-parallel-size 1 --max-model-len 32768 --kv-cache-dtype fp8 --gpu-memory-utilization 0.92
# no reasoning parser, no tool parser, no thinking mode; loaded in 122s
Don't be fooled by the size. This is the little one, and it's quick, but the lesson it taught me was about tokens rather than speed. A prompt that had comfortably fit every other model came back HTTP 400, and I spent a while assuming I'd fat-fingered a flag. LFM2.5 has a vocabulary of about 65,000 tokens against the Qwen family's 248,000, and a smaller vocabulary chops the same words into more pieces: the identical text that Qwen encoded in 29,715 tokens came to 33,139 here, an 11.5% jump, enough to overflow a 32,768 window that had held everything else. "128k context" is a fixed number of tokens, not a fixed amount of text, and how much text it buys depends on the model. It also declares no vendor sampling at all, so "just trust generation_config.json" isn't universal either.
Llama-4-Scout: ten million tokens you almost certainly don't want
# Llama-4-Scout-INT4, 64.9GB, both cards - CAP the context or pay for it
--tensor-parallel-size 2 --disable-custom-all-reduce
--max-model-len 32768   # NOT the native 10,485,760
--kv-cache-dtype fp8 --gpu-memory-utilization 0.92
# env: NCCL_P2P_DISABLE=1   # loaded in 1291s; docs recommend --tool-call-parser llama4_pythonic
Scout is the one that will happily hurt you with a default. Its model card advertises a native context of 10,485,760 tokens, and if you let the engine size a KV cache for that it will try, and you will have a bad time. The whole config for this model is one act of restraint: set --max-model-len to something a human needs, so the engine reserves cache for that and not for the ten-million-token conversation you're never going to have. Beyond that it's a well-behaved Llama 4, and the tool-calling docs say in one line that parallel tool calls aren't supported for Llama 3 but are for Llama 4, one of the quiet capability jumps the shared API shape hides.
The three I couldn't serve
A page that only listed wins would be dishonest, because three models beat me, and each failure is its own small lesson. Kimi-Linear-48B is the one that still nags. Its architecture is natively supported - KimiLinearForCausalLM is right there in the engine's registry - so "vLLM doesn't support it" is the obvious reading and the wrong one. The wall is the tokenizer: it ships a raw tiktoken.model and some custom Python and no tokenizer.json, so there's no fast-tokenizer fallback, and the only way to serve it is to run the shipped code or hand-convert the tokenizer and accept the risk of quietly skewing every token count I publish. The official upstream repo ships the identical files, so there was no cleaner source. I dropped it. Native support and a servable model turn out to be two different things.
Muse-Glimmer-30B was simpler and more frustrating: a Meta release six days old when I tried it, and MuseGlimmerForConditionalGeneration is simply absent from the pinned engine's registry. No card tells you that; the engine tells you, by refusing. It only ever loaded on a development image, which is a different rig than the one this page describes, so it doesn't get a block here.
And the community gpt-oss-120b AWQ from earlier, the one whose experts were never quantised. I've counted that as a failure too, because I lost real time to it before the metadata gave it away, and "the label was wrong" is exactly the kind of thing that should cost the person who shipped the label, not the person who trusted it.
Where to go from here
If there's one thread running through all twelve, it's the one from the top: the request shape is the doorway, and everything that decides whether a model runs - the quant that fits, the parser it needs, the switch that turns its thinking off, the sampling it was trained for - is a per-model fact you set at the server, once, at launch. Keep that discipline and one byte-identical client talks to your whole fleet.
The measured runs behind every block, with load times and the weekly sweep that re-checks them, are on the model testing page , and its pro-tips list is the traps that didn't fit a flag. The benchmark runbook holds the frozen dataset and the fit calculator. If you're starting from nothing, the set-up guide is the compose file and the WSL2 walls, and the rules these measurements overturned are the broken rules of local LLM inference . And if you're carrying a model that's fighting you the way a few of these fought me, send it over - if it runs on 96GB of Ada, it goes on the list.
Continue reading.
- Local AIThe VRAM traps: why a 16GB model wouldn't load on a 48GB card19 Aug 2026
- Local AIThe broken rules of local LLM inference19 Aug 2026
- Local AIMuse Glimmer 30B vs qwen: my day-one local benchmark on a dual RTX 4090 rig11 Aug 2026
- Local AIThe best local coding setup isn't one model: how I route across Claude, Kimi and my own rig24 Jul 2026
- Local AIHow to set up vLLM in Docker on Windows (WSL2): serve an open-weight model on your own GPU23 Jul 2026
- Local AIMoving houtini-lm to vLLM: What I learned22 Jul 2026