LLM Inference Optimization: What Made Two RTX 4090s Faster
In today's post I'm going through what made local LLM inference faster on my two modded 48GB RTX 4090s, in the order it mattered: the file format, how you split a model across cards, locking the clocks at boot, speculative decoding and load times, with the numbers from my own testing.
 Richard Baxter AI Ops & Marketing Engineer
 On this page
- What LLM inference optimization means on your own GPU
- Choose the quantisation format first
- Tensor parallelism vs pipeline parallelism
- GPU power limit vs clock lock
- Make the power limit and clock lock survive a reboot
- Speculative decoding: measure it before you trust it
- Load time: get the weights off the Windows mount
- Five rules that didn't survive measuring
Before I ran language models, I mined Ethereum on water-cooled 3090 rigs. Once a rig was built, most of the skill was in locking the core clocks and capping the power, and the card ran cooler and hashed higher. Counter-intuitive the first time you watch it happen, obvious after.
So when I had two modded 48GB RTX 4090s serving language models, I came back to the question I'd asked of the mining rigs: how do you get the most out of the GPUs you've got? With language models, that means tokens per second, and getting more of them is the whole of LLM inference optimization. On my rig, the file format you download made the biggest difference, and then how you split the model across your cards. Locking the clocks and capping the power costs you about 1% of decode speed and saves real watts. Speculative decoding can help, but measure it before you trust it. And if a model takes forever to load in Docker on Windows, it's usually the mount, not the model.
Those answers come from twelve models on two cards, tested over five days in August with follow-up runs the week after. I changed one thing at a time and measured each one. If you haven't run a local model yet, start with LM Studio. This guide assumes vLLM (the open-source server that loads the model and answers requests), and the setup guide is the way in.
Quick Navigation
What it means |
Quantisation format |
Tensor vs pipeline parallelism |
Power limit vs clock lock |
Survive a reboot |
Speculative decoding |
Load time |
Five rules
What LLM inference optimization means on your own GPU
Inference is running a trained model to get an answer out of it, and it happens in two stages. Prefill is the model reading your prompt, and it's limited by compute. Decode is the model generating its reply one token at a time, and that's what tokens per second (tok/s) measures. A token is a word or part of a word, and tok/s is the number you feel when you watch a reply stream in.
Decode is limited by memory bandwidth, which is how fast the card can read from its own memory (the VRAM). A model's weights, or parameters, are the billions of learned numbers it's made of, and the card reads them out of VRAM for every token it generates. That's why decode speed tracks the bytes read per token rather than how many parameters the model has, and the fewer bytes the card reads, the faster it goes. Almost everything below comes back to that.
So before you change anything, measure properly:
- Count tokens from the API's own reported usage, not from streamed chunks.
- Use the same client for every model and keep the per-model settings in the server launch, never in the client.
- Change one thing at a time.
- Read the context length back from the API's prompt-token count too, because my early rounds asked for a length and got about 1.9 times that.
My rig is two modded 48GB RTX 4090s, 96GB between them, at about £3,100 a card. GPU 0 sits on a PCIe x16 link and GPU 1 on an x4 link, and the whole thing runs vLLM 0.26.0 in Docker on Windows 11.

Choose the quantisation format first
Quantisation is storing a model's weights at lower precision, so the file is smaller and there are fewer bytes to read for each token. AWQ is a 4-bit format, and FP8 stores 8 bits per weight.
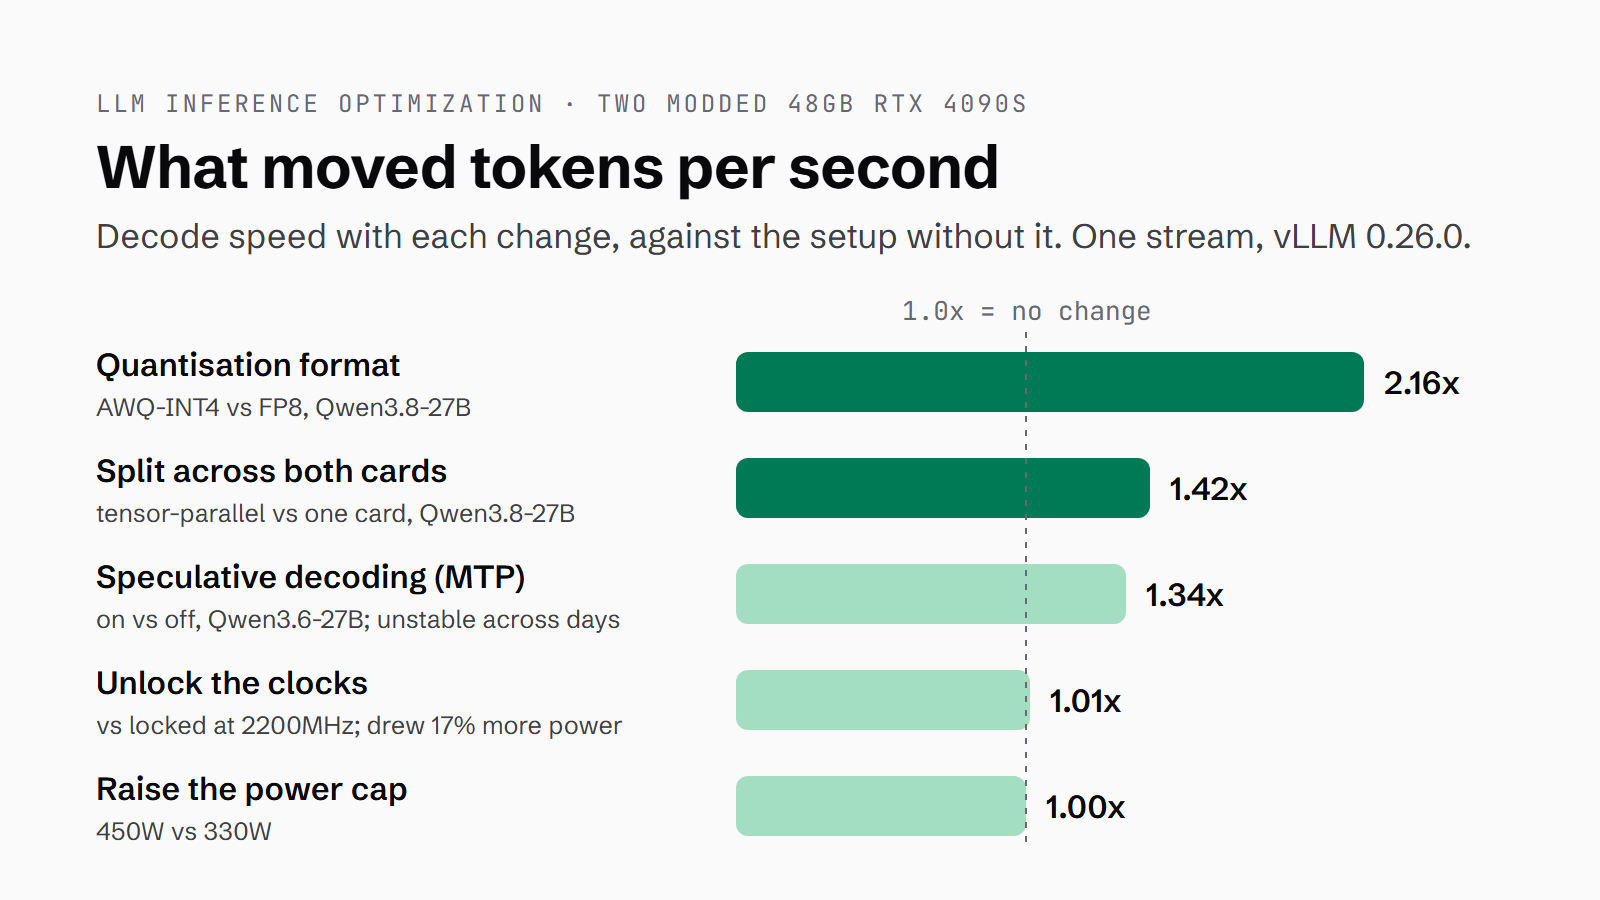
The same Qwen3.8-27B decodes at 35.8 tok/s as AWQ-INT4 and 16.6 as block-FP8. That's about 2.16 times the speed from the same model, and the only thing that changed was the file. Llama-3.3-70B goes the same way, 23.2 against 19.1, and that's the AWQ on one card while the FP8 version had to run across both.

gpt-oss-120b is the extreme case. It's a 117B mixture-of-experts (MoE) model shipped natively in MXFP4, another 4-bit format. An MoE model is split into many smaller sub-networks called experts, and gpt-oss-120b only activates four of them for each token, so per token it reads like a small model. It ran at 153.4 tok/s at short context and 140.7 with a 16k-token prompt, and it served its full 131,072-token context in 92.7GB. Most models are released in a 16-bit format, BF16, and at BF16 its weights alone would be around 234GB. So MXFP4 isn't being upconverted to BF16 on the 4090's Ada architecture, and vLLM's own capability check lets Ada run block-FP8, NVFP4 and MXFP4 too.
Across the whole fleet at short context, the spread runs from Nemotron-3.5-Lightning at 158.4 tok/s down to Qwen3.8-27B-FP8 at 16.6. That's nearly 10x, and parameter count explains almost none of it. Both ends of that range are FP8 files, so the format isn't what separates them. Nemotron-3.5-Lightning is a 30B MoE and the Qwen isn't, so per token the Nemotron reads a fraction of the bytes.
A "4-bit" label can mislead you, too: the Qwen3.8-27B AWQ is 27.7GB, not the 13.5GB the label suggests. The KV cache article covers where the rest of the memory goes, including the KV cache, which is the working memory the model keeps for your prompt and its reply so far.
Tensor parallelism vs pipeline parallelism
The rule I'd been working to was don't split a model that fits on one card. On my rig GPU 1 sits on an x4 link, which means it gets a quarter of the lanes GPU 0 has, and the cards would have to talk across it on every step. I believed it, and it was written down in my own docs as though it were settled.

There are two ways to split a model across cards. Tensor parallelism (TP) cuts every layer in half and gives each card one half. Pipeline parallelism (PP) gives each card different layers, so the work passes from one card to the next. TP2 means tensor parallel across two cards, and TP1 is a single card.
I measured it on Qwen3.8-27B, which fits comfortably on one 48GB card, with a long prompt of about 29k tokens. It ran as a single stream, one request at a time. TP1 decoded at 34.4 tok/s. TP2 decoded at 48.9, which is 42.2% faster from splitting a model that never needed splitting. PP2 came in at 32.9, slower than one card on its own.

The reason goes back to bytes per token. Under TP each card holds half of every layer, so each card reads half the bytes for every token and the pair gets double the memory bandwidth. The cost is the all-reduce. That's where the two cards combine their partial results, which they do over the x4 link on every step. Doubled bandwidth beats it with room to spare. PP doesn't get that win, and while one card works the other waits, which is the pipeline bubble.
The load was quicker too, 9.2 minutes for TP2 against 14.6 for TP1.
Before anyone re-architects on my say-so, this is one model, one context, single stream. What TP2 does under four simultaneous streams hasn't been tested yet.
GPU power limit vs clock lock
These are two levers, not one, and you set both with nvidia-smi, the command-line tool that installs with NVIDIA's driver. A power limit (nvidia-smi -pl 330) caps the card's sustained board draw. The card still boosts up to its clock ceiling and throttles back when it runs out of watt budget, so the draw stays spiky. A clock lock (nvidia-smi -lgc 0,2200) caps the boost clock itself. The card never tries its high-voltage clock states, so the draw goes flat. It's what years of mining taught me:
"Lock the clock and it smooths out the power draw from being very spiky to being dead consistent. Less power, lower temps, little trade-off."
On 17 August I ran three conditions in one session, with the model loaded once and the settings changed live. A is my production setting, 330W and locked. B raises the cap to the stock 450W and keeps the lock, which isolates the power limit. C keeps 330W and unlocks the clocks, which isolates the clock lock.
| Condition | Qwen3.8-27B (one card) | Llama-3.3-70B AWQ (split across both cards) | Peak temp (Qwen / 70B) |
|---|---|---|---|
| A: 330W cap, clocks locked (production) | 35.1 tok/s at 279.8W | 34.9 tok/s at 561.9W | 62C / 64C |
| B: 450W cap, clocks locked | 35.1 tok/s at 284.6W | 35.2 tok/s at 586.1W | 63C / 66C |
| C: 330W cap, clocks unlocked | 35.5 tok/s at 327.3W | 35.1 tok/s at 652.4W | 67C / 67C |
Decode barely moved. Qwen3.8-27B ran 35.1, 35.1 and 35.5 tok/s across A, B and C, and Llama-3.3-70B across both cards ran 34.9, 35.2 and 35.1. The electricity did move. Unlocking the clocks pushed the Qwen's mean draw from 279.8W to 327.3W, which is 17% more power for about 1% more decode. On the 70B it added roughly 90W for under 1%, and both ran hotter. Raising the cap to 450W left decode where it was and moved the Qwen's draw by under 2%. Decode is bandwidth-bound, so clocks above about 2200MHz buy almost nothing at decode. What the lock does to prefill I haven't cleanly measured.

The real reason to cap is the 1200W power supply. Two cards at 330W plus about 200W of system is around 860W, which leaves about 340W for transients, the microsecond spikes a 4090 throws above its rated draw. At the stock 450W it's about 1,100W, close enough to the limit that a spike can trip the power supply's over-current protection and shut the machine off. My modded cards also crash under load at unlocked clocks and are stable with the lock. These are the commands, and they need an elevated (administrator) terminal on Windows, or sudo on Linux:
nvidia-smi -pl 330          # power limit in watts, every GPU
nvidia-smi -i 0 -pl 330     # one GPU
nvidia-smi -lgc 0,2200      # lock the graphics clock range: floor 0, ceiling 2200MHz
nvidia-smi -rgc             # reset the clocks to default
The floor of 0 is there for idle. -lgc 2200 on its own pins 2200MHz even at idle, which is hotter and noisier; with the floor at 0 it idles at about 210MHz. -rgc resets it, and with no -i flag each of these commands applies to every GPU.
One more thing to watch out for: you can't query whether a clock lock is on. On driver 610.88, clocks.max.graphics reports the 3105MHz hardware ceiling locked or not, so the only check is watching the clocks under load:
nvidia-smi --query-gpu=index,clocks.gr,power.draw,temperature.gpu --format=csv -l 1On the 17 August 70B runs, GPU 0 read 2640MHz and above despite the lock. So the 70B column in the table above isn't a clean locked-against-unlocked comparison on that card, although the gap in draw between A and C still held. On 23 August, checked under load, both cards peaked at exactly 2190MHz, the nearest clock step below the 2200 ceiling.
Make the power limit and clock lock survive a reboot
Neither setting survives a reboot, so both have to go back on every time the machine starts. On my rig that's two elevated scheduled tasks at logon. GPU-PowerPolicy runs nvidia-smi -pl 330. Twenty seconds later, LocalLLM-Bootstrap runs a script that checks the power limit and reapplies it only if it's wrong, then locks the clocks. After that it waits for Docker, starting it if it isn't running, brings up the vLLM stack and sends the model a one-token warm-up request, so the first real request doesn't wait.
Loading a model is the first heavy GPU burst of the session, and on these cards a dual-GPU load burst is the highest crash risk, which is why both protections land before any model loads. Here's the installer, which you run once from an elevated PowerShell. The first line points at my boot script, so write your own first (the nvidia-smi lines above are the minimum) and change the path to wherever it lives. This registers LocalLLM-Bootstrap only; GPU-PowerPolicy is the same recipe with no delay and nvidia-smi -pl 330 as the action:
$script = 'C:\dev\local-llm\vllm\bootstrap.ps1'
if (-not (Test-Path $script)) { throw "bootstrap.ps1 not found at $script" }

$action = New-ScheduledTaskAction -Execute 'powershell.exe' `
  -Argument "-NoProfile -ExecutionPolicy Bypass -WindowStyle Hidden -File `"$script`""

# At logon of THIS user, with a short delay so Docker Desktop has begun starting.
$trigger = New-ScheduledTaskTrigger -AtLogOn -User "$env:USERDOMAIN\$env:USERNAME"
$trigger.Delay = 'PT20S'

# Run as the logged-in user (so Docker Desktop's per-user context is visible) but
# elevated (RunLevel Highest) so nvidia-smi can change clocks.
$principal = New-ScheduledTaskPrincipal -UserId "$env:USERDOMAIN\$env:USERNAME" `
  -LogonType Interactive -RunLevel Highest

$settings = New-ScheduledTaskSettingsSet -AllowStartIfOnBatteries -DontStopIfGoingOnBatteries `
  -StartWhenAvailable -ExecutionTimeLimit (New-TimeSpan -Minutes 15) -RestartCount 1 -RestartInterval (New-TimeSpan -Minutes 2)

Register-ScheduledTask -TaskName 'LocalLLM-Bootstrap' -Description 'Warm the local LLM rig at logon: wait for Docker, start vLLM+router, reapply GPU clock lock, warm the model.' `
  -Action $action -Trigger $trigger -Principal $principal -Settings $settings -Force | Out-Null
This is the lock step inside the script:
& $smi -lgc 0,2200 *>> $log 2>&1
if ($LASTEXITCODE -eq 0) { Log "GPU core-clock lock applied: 0,2200 MHz (not queryable - verify under load)" }
else { Log "CLOCK LOCK FAILED (exit $LASTEXITCODE) - not admin? use prep.bat (elevates), not warm.bat" }
The log says "applied", not "verified", because the lock can't be verified by query. The only proof is watching the clocks under load. The prep.bat and warm.bat in the failure line are my shortcuts for running the script by hand: prep.bat elevates and locks the clocks, and warm.bat just loads the models. On Linux you'd do the same with a systemd service that runs at boot, alongside nvidia-persistenced to keep the driver loaded between jobs.
Speculative decoding: measure it before you trust it
Speculative decoding uses a small, fast drafter to guess several tokens ahead. The main model then checks those guesses in one pass, and the ones it accepts come for free. MTP (multi-token prediction) is the same idea using the model's own built-in draft head.
I tested it on Qwen3.6-27B AWQ, the Qwen before 3.8, and the drafter itself was healthy. It had 696 of 1,008 draft tokens accepted, about 69%, with 78.8% for its first guessed token and 59.3% for its second. Working out what that bought me was harder.
I measured the same switch five times:
- On the older 0.25.x engine it gave about 1.9x.
- My first sweep on 0.26.0 booked it as a 44% slowdown, which was a bug in my own benchmark harness. It counted streamed chunks as though each one carried a token, and speculative decoding bundles about 2.4 tokens into every chunk.
- A quick wall-clock check then over-corrected to +26%.
- On 19 August it came out neutral, and that didn't reproduce.
- The best evidence is the same-day A/B on 23 August, with two fresh containers per arm: 47.3 tok/s off, 63.0 and 63.5 on. That's +34%, and it held at every context.
I still kept it off in production. On 0.26.0, MTP can deadlock the engine while it reads a long prompt that has nothing cached yet. The engine spins, and its /health check still reports that everything is fine. That makes it a priced trade: about 34% more decode with MTP on, against the risk of a hang.
If you try it, count tokens from the API's usage figure, never chunks, and run your on and off comparison on the same day. Across days on 0.26.0 the result wouldn't hold still.
Load time: get the weights off the Windows mount
Docker on Windows reads Windows-side files through 9P, the file-sharing protocol WSL2 uses, and 9P pays a latency cost on every file operation. My models sat on a bind mount, a Windows folder mapped straight into the container. On 12 August I tested it with dd, a basic disk-read test, got 530MB/s of sequential reads and concluded that moving the weights would buy nothing. That was wrong. The dd number was accurate, but the loader doesn't read one long sequential file. It does thousands of small operations, and every one of them pays the 9P latency.
In the controlled A/B, the mount was the only thing I changed, with the order alternated and two runs of each. The bind mount loaded in 763 and 762 seconds. A Docker volume is storage Docker keeps on WSL2's own ext4 Linux filesystem, away from the Windows side and 9P, and loading from one took 203 and 204 seconds, which is 3.75 times faster. The one-off copy onto the volume took about 175 seconds per model.
When I moved the whole fleet on 24 August, the biggest models gained the most. Small models gained less, because their load is mostly the engine starting up:
| Model | Load on the 9P bind mount | Load from a Docker volume |
|---|---|---|
| gpt-oss-120b | 1,334s | 164s |
| Llama-3.3-70B-FP8 | 1,536s | 185s |
| Qwen3.8-27B-AWQ | 1,470s | 216s |
| LFM2.5-1.2B | 122s | 84s |
If you can't move the weights, there's a vLLM launch flag, --safetensors-load-strategy=prefetch. In a separate test that day it cut a 9P load on Qwen3.8-27B-AWQ from 1,028 seconds to 756, about 26% quicker. It never switches on by itself over 9P, because its auto setting only recognises network filesystems like NFS and Lustre, so you have to ask for it. The volume still won, at 228 seconds.
Five rules that didn't survive measuring
I went in with five rules I'd taken as settled: run the cards flat out, never tensor-split a model that fits on one card, the RTX 4090's Ada architecture has no kernels for the new low-bit formats, MXFP4 upconverts to BF16 on Ada, and the 9P mount doesn't affect load time. Three of them were mine, written into my own docs as fact.
They all had the same history. Each one started as a guess from something that looked close enough, like a dd read standing in for a model load, then got written down without its source and inherited as though it had been measured. Twice I built automation to enforce a rule that measurement then killed.

I logged seventeen instrument failures along the way, times when the tool giving me the number was what was wrong. The two rules I trust now are to suspect the instrument before the subject, and to read the number, not the verdict.
If I were tuning a local rig from scratch, this is the order I'd do it in:
- Pick the quantisation format first.
- Decide how to split the model across your cards, and test TP before you rule it out.
- Lock the clocks and cap the power at boot, before any model loads.
- Move the weights off the Windows mount onto a Docker volume.
- Test speculative decoding on your own workload.
- Throughout, measure tokens from the API's own count, one change at a time.
It's one thing to be able to use chat - well done, you can type. Configuring a model to run at its best in vLLM, on hardware you own, with settings you can defend because you measured them, is a different discipline. It looks a lot more like the mining bench: lock the clocks, cap the power, trust nothing you haven't watched under load.
The benchmark hub has the dataset and the fit calculator, the KV cache article covers memory, and the vLLM setup guide gets you running.
If you're carrying a rule you've never measured, tell me about it. If it's testable on 96GB of Ada, it goes on my list to test.
Continue reading.
- Local AIvLLM settings for a pair of RTX 4090s: the flags I run for twelve local models, and why
- Local AIKV Cache Explained: Why a Local LLM Won't Load on Your GPU
- Local AIMuse Glimmer 30B vs qwen: my day-one local benchmark on a dual RTX 4090 rig
- Local AIBest Local LLM for Coding, Plus the API and Image Models I Use
- Local AIHow to set up vLLM in Docker on Windows (WSL2): serve an open-weight model on your own GPU
- How-to GuidesHow to run houtini-lm on vLLM