Our Model Testing
Every model recommendation on this site traces back to a number we measured ourselves. This is where the question - is this model any good on hardware like this? - gets answered with a stopwatch rather than a forum thread: what we run, how we run it, and what the leaderboards won't tell you.
The short version of why: we run a local AI fleet as a delegation sidekick - a set of models on our own hardware that a frontier orchestrator (Claude) hands bounded work to, so paid API tokens get spent only where frontier reasoning earns them. That architecture only works if you know, precisely, what each local model can do and how fast. Guessing isn't knowing. So we test.
Quick Navigation
What we test on | How we test | The current numbers | Trending on Hugging Face | The frontier models | Pro tips | Use this with Claude | The full write-up
What we test on
The current rig is a pair of modded 48GB RTX 4090s - 96GB of VRAM between them - with 128GB RAM, serving with vLLM in Docker and orchestrated by houtini-lm. Not datacentre hardware, deliberately: the point is what's achievable on a machine an enthusiast or a small studio can realistically build. The single-card numbers below are one slice; the dual-card and tensor-parallel figures are measured now too - tensor parallelism runs 42% faster than a single card on a model that fits one, and a 120B serves across both - and they live in the benchmark hub .
The settings matter more than the card, and almost nobody publishes them. Both cards are capped at 330W by measurement, not left on the default. The core clocks are locked to 2200 MHz before anything loads - on modded 48GB cards that is a stability requirement, not a tuning choice. Whether the lock actually holds under load is a question we have left open: clocks.max.graphics reports the hardware ceiling whether it is locked or not, and under load we have read the running clocks at 2190 MHz on one sweep and 2640 MHz on another, so we treat enforcement as unverified and have a re-run scheduled. The power policy stands on its own regardless - capping and locking cost nothing measurable on decode and save around 90W a card. Most presets run an fp8 KV cache, which is the trick that lets a 131k to 262k token context actually fit. The stack underneath is driver 610.88 on CUDA 13.3, WSL2, vLLM in Docker, and presets are single-GPU unless a row says TP=2. Change any of those and the numbers move, which is exactly why they are on the page.
How we test
We test local large language models in three phases.
The first is our own rig harness, and it is the one that matters most here. Five scenarios, chosen to look like real delegation traffic rather than a generic serving benchmark: single-stream decode, cold time-to-first-token on a 16k code-shaped prompt, the same prompt again to show the prefix cache working, decode speed with 16k already resident, and four requests running at once. Temperature 0 throughout, token counts read straight from the server. The script is the spec - run it and you get our runs.
The second phase is vLLM's own vllm bench serve, pinned to fixed parameters (ShareGPT V3, 64 prompts, seed 42, eight-way concurrency) so you can point it at your own hardware and compare like for like. Our healthy qwen reference at those settings is 261.7 tok/s output, 838ms mean time-to-first-token, and 25.6ms per output token.
The third phase is quality, and we deliberately leave it out of the routine sweep. A speed table is a speed table; it never implies one model is smarter than another. When a throughput crown is contested we run a bounded task set as a one-off and label it as exactly that.
The method is frozen as v1. Rows are only comparable within a method version, so when the method changes, the version does too.
So the question we're trying to answer is simple: what can these models do, what are their quirks, and therefore which one is best for the job?
The current numbers
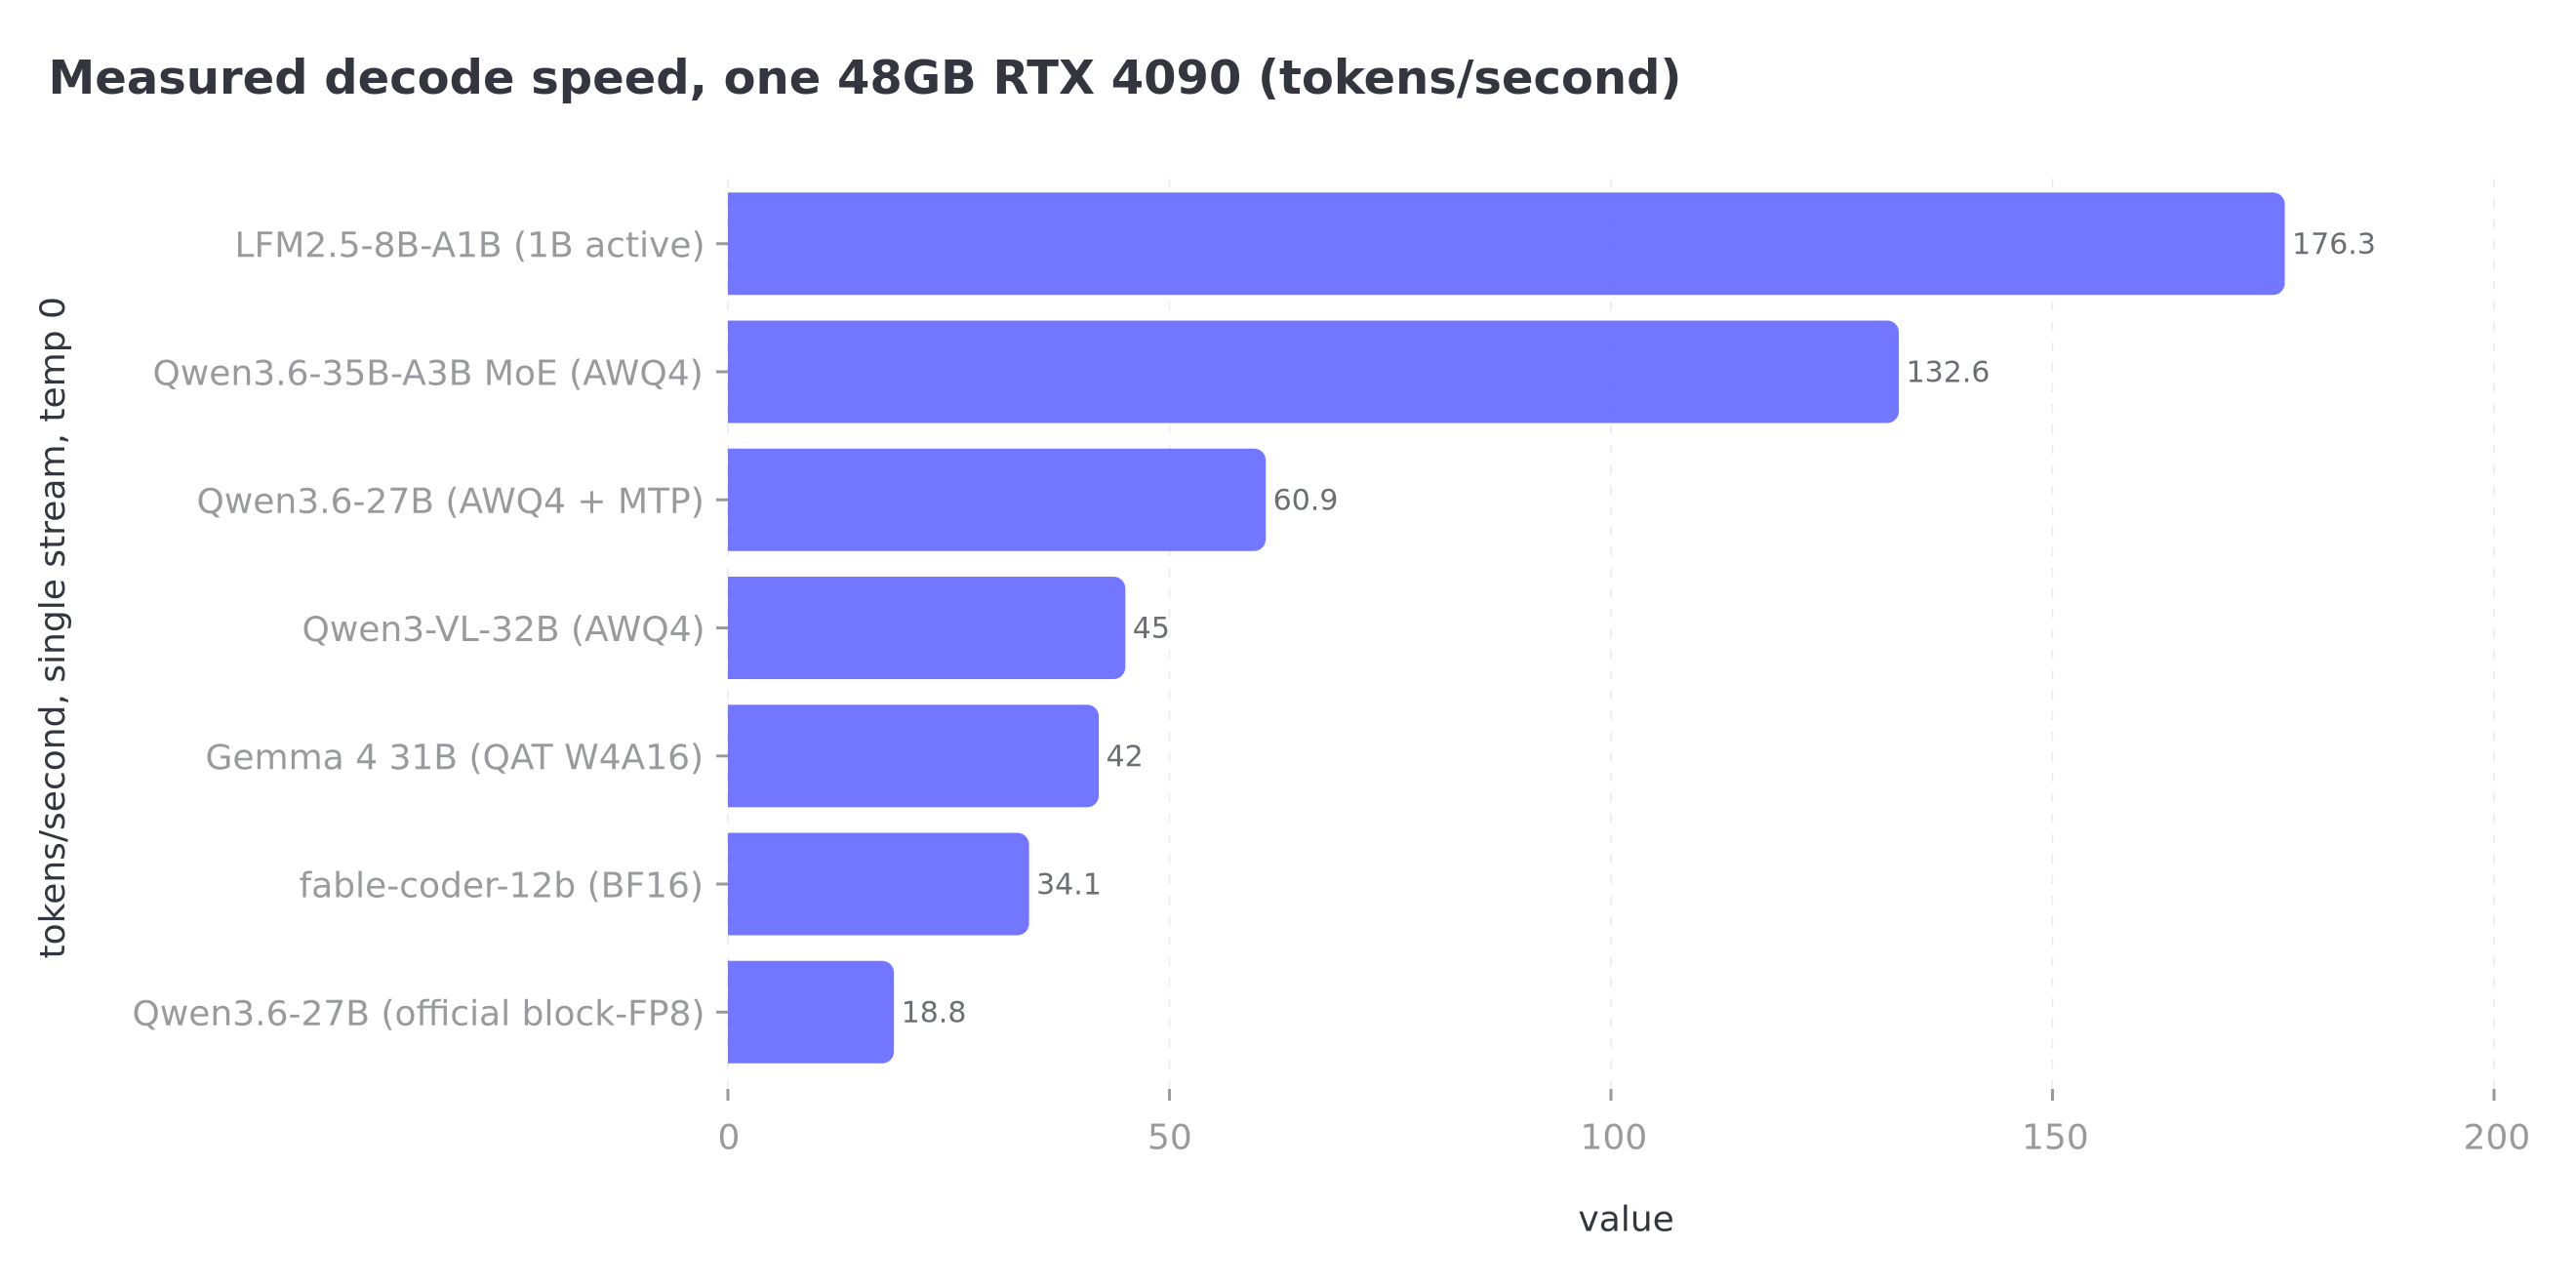
The fleet as it stands, measured 9 August 2026 on the single 48GB card at the standing 330W power policy. A scheduled sweep re-runs these weekly and this table tracks it. This is the single-card line-up; the full twelve-model dual-4090 campaign - every flag, every load time, and the raw dataset - is in the benchmark hub . One caveat carried forward: MTP's measured effect has swung with the engine version - roughly +1.9x on 0.25.x, and the best current evidence (a same-day A/B on the 08-23 sweep, reproduced) is +34% on the pinned 0.26.0. Production still runs nomtp, but on the cold-prefill deadlock alone, not because it is free - that choice now costs about 25-34% of throughput, a priced trade.
| Model | Quant | Decode tok/s | Prefill tok/s | Repeat TTFT | Role |
|---|---|---|---|---|---|
| LFM2.5-8B-A1B | BF16, 1B active | 163.5 | 14.4k | 0.05s | extraction and utility |
| Gemma 4 26B-A4B | QAT AWQ-INT4 MoE | 148.3 | 10.7k | 0.09s | fast general, challenger to the 31B |
| Qwen3.6-35B-A3B | AWQ4 MoE | 120.1 | 11.9k | 0.22s | fast general daily driver |
| Qwen3.6-27B | AWQ4 + MTP | 56 | 2.0k | 1.33s | coding accuracy pick |
| Qwen3-VL-32B | AWQ4 | 43.4 | 1.5k | 0.08s | precision vision and OCR |
| Gemma 4 31B | QAT W4A16 | 40.3 | 1.4k | 0.12s | no-think general assistant |
| fable-coder-12b | BF16 | 32.8 | 4.6k | 0.08s | fast TypeScript |
| Qwen3.6-27B (untuned) | official block-FP8 | 18.8 | 3.9k | 4.7s | the before picture, kept for reference |
| Muse Glimmer 30B | FP8 block | 16.3 | 3.6k | 0.09s | prefill specialist, weak decode |
The number to look at is our first dual-GPU resident: Nemotron 3 Super 120B (TP=2 across both cards, so it sits outside the single-card table above). It holds 62.7 tok/s decode with 16k tokens resident - essentially no drop from its short-context figure, because nothing degrades as the context fills up. The tuned single-card 27B holds its decode at 16k too on the current engine; the standout here is getting that flat retention at 120B scale across two cards. That is the Mamba2 hybrid architecture doing exactly what it says on the tin, and for long-document work it is the most interesting figure on the page. At the other end, Muse Glimmer 30B is in the table above as an honest split: the best prefill in the fleet by a distance (+75% on qwen) and the worst decode. A prefill specialist, not a daily driver.
Decode is single-stream at temperature 0; prefill and TTFT are a 16k-token prompt; repeat TTFT shows prefix caching working. The last row is the same 27B before tuning - the gap between 18.8 and 66 is what the deep-dive below explains.
These are not one-off readings. The most recent scheduled sweep, on 23 August, re-measured the whole fleet and reproduced it: thirteen of the fourteen rows landed within measurement noise, no regressions anywhere, and seven models sat inside 0.7% of the week before. The speed king, Nemotron-3.5-Lightning, even nudged up 4% to 164.8 tok/s. That model is having a community moment right now - its GGUF requants have crossed 126,000 downloads since mid-August - but the number here is measured on the served FP8 build and predates that wave. Week-on-week stability is the whole reason the sweep runs on a schedule rather than once.
See what's trending on Hugging Face
The fleet above is what we run; this is what everyone else is pulling right now. It reads the Hugging Face trending list live, and the dropdown filters it to the models that will actually fit your card. Handy for spotting the next thing worth benchmarking.
Live from the Hugging Face API. VRAM is a rough estimate for a 4-bit quant (about 0.6GB per billion parameters plus a little headroom); the real fit depends on the quant you pick and how much context you run.
The frontier models, as reported
The local fleet exists to take work off paid APIs, so the other half of the measurement question is what those APIs cost and deliver. Unlike everything above, these are reported numbers - vendor list pricing and public leaderboards, not our harness - and we keep that distinction loud on purpose. List prices move, so the frontier comparison on our research page now tracks them live from OpenRouter's public feed; the table below keeps the figures as they stood in July 2026, when we wrote this. The gauntlet runs against the frontier APIs (same TypeScript task, same tool-calling gate - the harness doesn't care that the endpoint is remote) are queued; when they land, this table gets our numbers.
| Model | $/Mtok in / out | SWE-bench Verified | The one-line read |
|---|---|---|---|
| Claude Fable 5 | $10 / $50 | 95.0% | The long-horizon king; the tool-calling reliability benchmark |
| Claude Opus 4.8 | $5 / $25 | 88.6% | The reliable workhorse at half Fable's price |
| Kimi K3 | $3 / $15 | 76.8% | Vision in the agentic loop - fixes CSS from browser screenshots |
| DeepSeek V4 Pro | $0.435 / $0.87 | 80.6% | ~80% of frontier coding at ~28x cheaper output than Opus |
| MiniMax M3 | $0.60 / $2.40 | 75.0% | Budget text throughput; weak agentic scores on current comparisons |
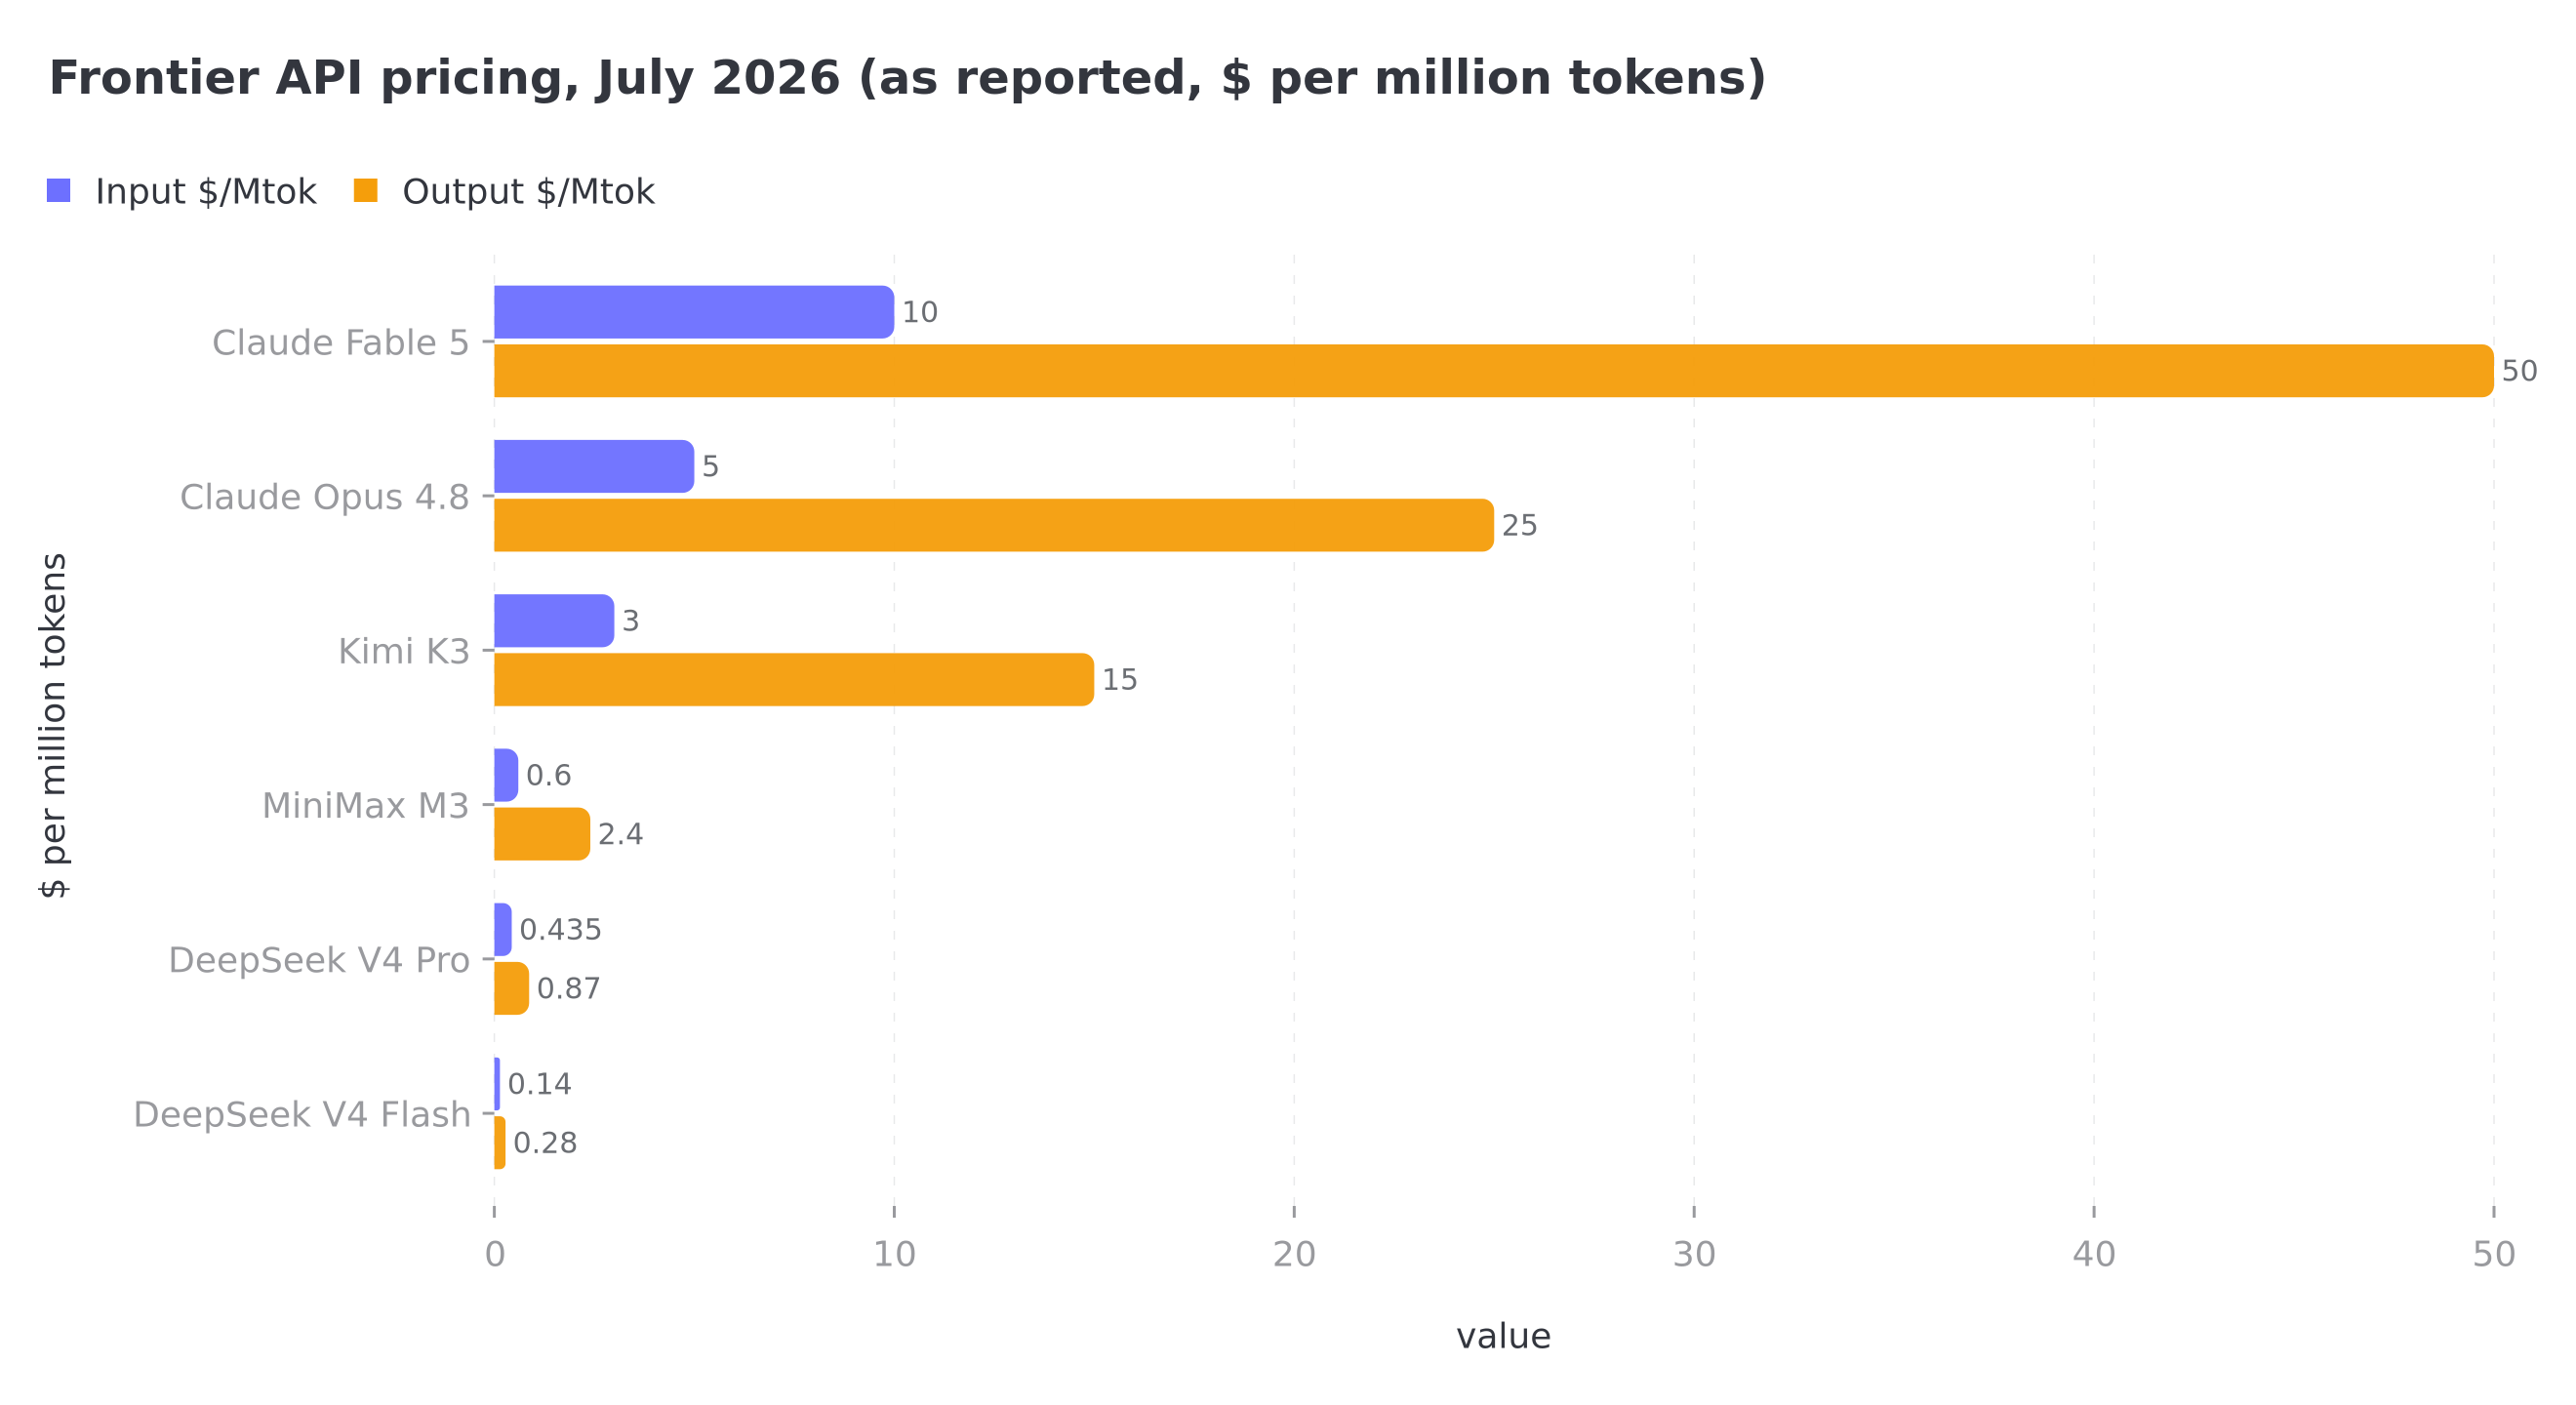
The chart is the whole economics argument in one picture: two orders of magnitude separate the cheapest and most expensive output tokens on the frontier, and a local token costs none of it. The hardware isn't free, of course - our GPU guide covers what the cards cost and which make sense - but once a card is on the desk, every token it decodes takes work off the metered tiers above. That's the comparison that matters: not local versus cloud as a religion, but which tier each job deserves.
The routing conclusion is ours, and it's a three-tier ladder: the local fleet for bounded work (free after hardware, measured), DeepSeek V4 Pro as the candidate middle tier for high-volume agent loops (unverified by us, so no real work routes there yet), and Claude for orchestration and anything where being wrong costs more than the tokens. Tool-calling reliability - the thing our whole delegation architecture depends on - is where the frontier lead is least contested.
Pro tips from working with these models
The useful part of running a fleet is everything the documentation leaves out. Here are the traps that cost us real time, each with the fix and the number that proves it.
- Restart the engine between benchmark runs. A vLLM engine driven into a bad scheduling state keeps returning 200s and keeps answering benchmarks - just 60x slower - while the container health stays green. Swap presets and it restarts for you; re-run the same preset and it does not, so do it by hand. Skip it and you can spend hours measuring a wedged engine and blaming the model.
- Never benchmark speculative decoding on random tokens.
--dataset-name randomcollapsed an MTP preset to about 1 tok/s that serves real text at 262. Speculative decoding predicts likely continuations, and random tokens reject every draft. Use ShareGPT or your own real prompts. - Read three things on the model card before you load it: the recommended sampling, how to switch reasoning off, and whether it fences code. On one 120B, generic defaults gave us 2 of 6 build phases and 58,747 output tokens; the same model with its documented settings gave 6 of 6 and 18,481. Three settings, 68% fewer tokens, five times the usable output.
- Load time is dominated by where the weights live - and a sequential disk test will tell you the opposite. A
ddread of the WSL2 9P bind mount clocks 530MB/s - fast enough to read 77GB in about two and a half minutes, so it looks blameless. It is not. vLLM's loader is thousands of small operations, and 9P pays a per-operation latency on every one that a sequentialddnever touches. Move the same weights into an ext4 Docker volume and the fleet loads 4.5 to 9 times faster: Nemotron-Super 120B drops from 1,816s to 202s, gpt-oss 120B from 1,334s to 164s. A same-model A/B settles it - 9P bare 1,028s against 228s from the volume. If you cannot migrate,--safetensors-load-strategy=prefetchclaws back 26% on 9P (it never auto-fires there - vLLM only auto-enables it on NFS and Lustre), but the volume still wins by a distance. The GPU-1 PCIe x4 link is a separate tax: it slows the TP=2 all-reduce during inference, not loading. - Set `HF_TOKEN`. Anonymous HuggingFace pulls hit a rate limit that drops the loader into a silent backoff - no error, no message, just a process that looks hung. The token removes it and roughly doubles download speed as a bonus.
- Large download dying with a CAS decode error? Retry with
HF_HUB_DISABLE_XET=1; it resumes from what is already on disk. - Check architecture support before you pull tens of gigabytes. A one-line
docker runagainst the image's ModelRegistry tells you whether the model will even load before you spend an hour downloading it. - Day-one models often need a model-specific image tag, not
:latest, and the CUDA version baked into that image can outrun your driver - in which case the container dies at the nvidia prestart hook before vLLM even starts. - A model that crashes in multimodal profiling can still be fine for text.
--limit-mm-per-prompt.video 0 --limit-mm-per-prompt.image 0gets you a working text endpoint while the vision path is broken upstream. Worth trying before you write a model off. - Speculative decoding plus a big batched-token budget can deadlock. 16384 with MTP wedged on a 16k cold prefill - engine at 95% CPU, GPU pegged but drawing only ~72W, health still green. 8192 is both safe and faster on that preset, so there is nothing to trade.
- Coarse progress bars look exactly like a hang. Shard loading reports per shard, and a 120B shard can take 150+ seconds. Split the log on carriage returns and check whether VRAM or read_bytes is still moving before you call it frozen.
- If your harness records config next to results, filter the secrets. Ours captured the whole
.envinto a git-tracked results file. Fine until a token goes in it. - Comparing models? Send an identical request body. A single model-specific flag - a thinking toggle, say - silently rigs a token comparison, because one model pays for its chain of thought and the other gets a free pass.
The thread running under all of these is the same, and it is the one discipline worth taking away: a number that was inferred rather than measured gets written down as a fact, and every decision after it inherits the mistake. A slow load blamed on a filesystem, a wedged engine blamed on the model - measure the thing instead. dd takes fifteen seconds.
Use this with Claude
The practical way to use these findings is houtini-lm , our open-source MCP server that connects Claude to your local models. Claude orchestrates; your hardware executes; your API bill shrinks. It works with LM Studio out of the box and with a vLLM stack like ours - the model routing in it is built directly from the measurements on this page.
If you'd like help building this kind of setup for your team - local inference, agentic workflows, or the measurement discipline itself - that's exactly what our consulting and agentic AI services cover. Our tools page has everything we've open-sourced.
The full write-up
Two pages carry the detail. The vLLM settings page is the flag-by-flag reference: the baseline every preset shares, the flags that change per model, the rig discipline, and one verified launch block for each of twelve models with the reason attached. The benchmark runbook is the measurement record behind this table - the frozen dataset, the power, topology and quantisation experiments, and the method. The harness itself lives in the repo, because a benchmark you can't interrogate is just an opinion with digits.
Questions about the testing, or a model you think we should run? Get in touch .