Chrome DevTools MCP: AI-Powered Website Debugging
Learn how Chrome DevTools MCP transforms website debugging from manual detective work into AI-powered analysis. Get expert-level insights on Core Web Vitals, SEO issues, and performance optimisation in minutes instead of hours.
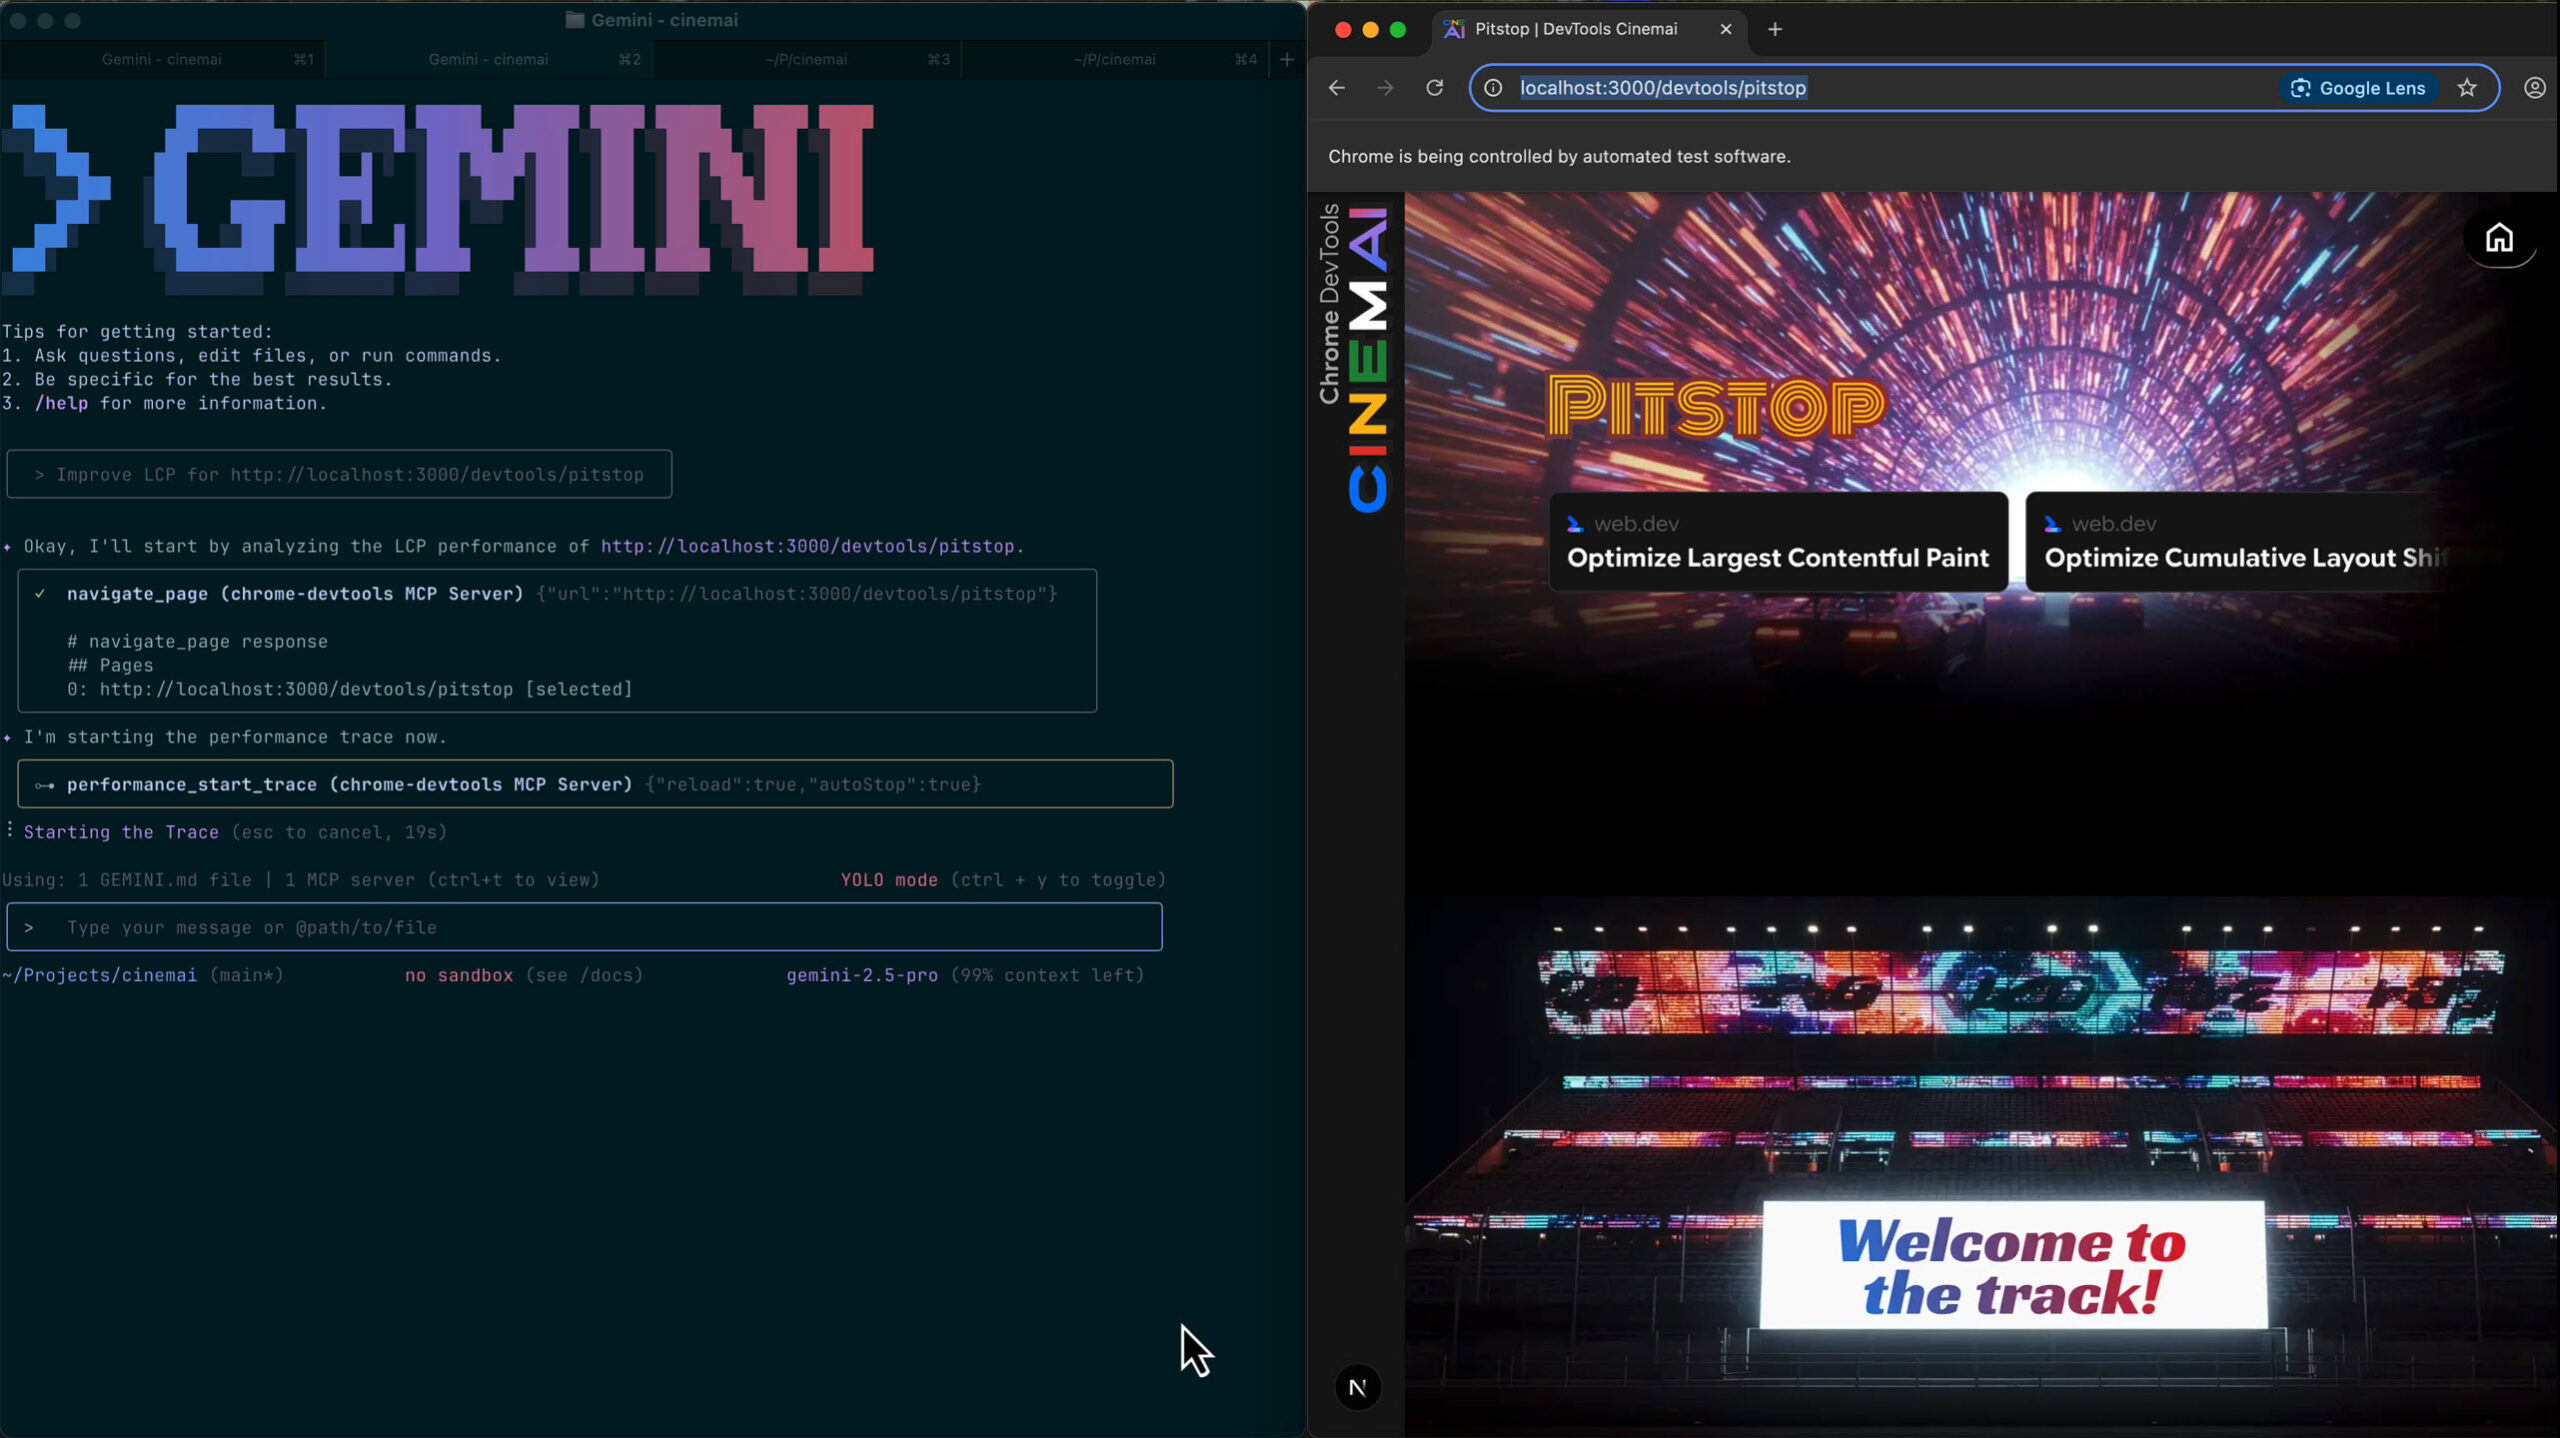
Your website needs the odd bit of maintenance, and when something breaks or feels slow you need to work out what's wrong, why, and how to fix it. Traditionally that meant learning Chrome DevTools yourself - the browser's go-to kit for everything happening in the page.
The Chrome DevTools Model Context Protocol (MCP) server changes the way you approach this completely. Instead of manually interpreting waterfall charts and console errors, you can now ask Claude: "Why is my blog post loading so slowly?" and get expert-level analysis with specific, actionable recommendations.
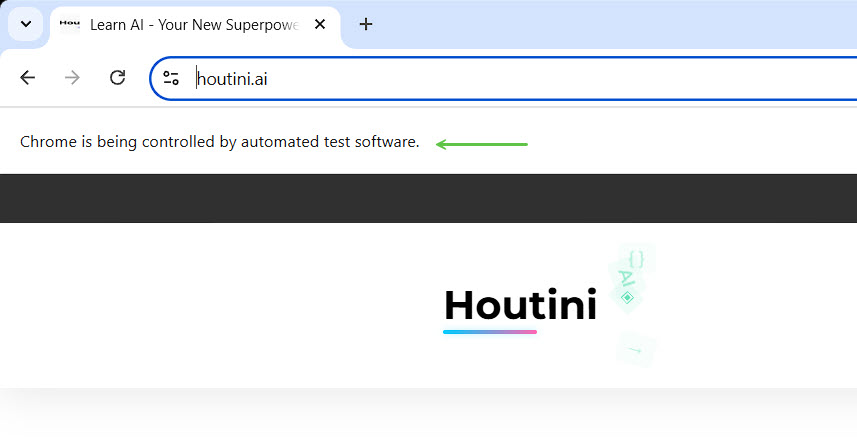
This isn't about replacing your technical skills - it's about amplifying them and making you way more productive. Think of it as having a web performance engineer sitting beside you, ready to explain what every metric means and what you should do about it.
Before we begin:
What is the Model Context Protocol?
The Model Context Protocol is an open-source standard that connects large language models like Claude to external tools and data sources. Think of it as a bridge that lets AI assistants interact with real-world applications instead of just processing text.
At Houtini, we've been building MCP servers since the protocol launched - eleven of them now, open-source under @houtini. Our current toolkit includes:
- houtini-lm: Language model routing and comparison
- gemini-mcp: Google's Gemini API integration for research and analysis
- brevo-mcp: Email marketing automation and customer data
- More coming soon: We're constantly expanding our MCP capabilities
Each server gives Claude access to specific tools and data, but the Chrome DevTools MCP is particularly exciting because it solves a fundamental problem: AI agents have been programming with a blindfold on. I've been working around this problem by using Puppeteer which is packaged with the MCP SDK, but this method is much cleaner and uses a lot less thread length.
Introducing Chrome DevTools MCP
Google's Chrome DevTools MCP server brings Chrome's debugging tools to your AI assistant.
Instead of manually:
- Opening DevTools
- Running performance traces
- Interpreting network waterfalls
- Analysing console errors
- Cross-referencing different panels
You can now ask Claude to do all of this automatically and explain the results in plain English.
This stuff is powerful because it's the difference between knowing your LCP is 4.2 seconds and understanding that it's caused by an unoptimised hero image that needs WebP conversion and responsive sizing.
Installation
if you're not sure how to install an MCP server, I've written a very quick guide for you .
Add this to your MCP client configuration:
{
  "mcpServers": {
    "chrome-devtools": {
      "command": "npx",
      "args": ["-y", "chrome-devtools-mcp@latest"]
    }
  }
}
Test it works by asking Claude: "Please check the LCP of web.dev"
Use Cases for Chrome Dev Tools MCP
Obviously SEO / Web dev and content people use Chrome DevTools, here are some of the ideas Claude and I had on how to use the MCP:
1. Core Web Vitals Analysis & Debugging
- LCP Issues: Automatically identify slow-loading hero images, render-blocking resources
- CLS Problems: Find layout shifts from ads, images without dimensions, dynamic content
- INP/Responsiveness: Debug slow JavaScript execution blocking user interactions
- Real-time monitoring: Get live CWV metrics without manual DevTools navigation
2. JavaScript SEO Auditing
- Console Error Detection: Find JavaScript errors blocking content rendering
- Client-side vs Server-side Content: Verify what Googlebot actually sees vs fully rendered content
- Render Comparison: Compare raw HTML source with JavaScript-rendered final content
- Hidden Content Analysis: Detect text hidden via CSS (
display:none,visibility:hidden)
3. Technical SEO Validation
- Meta Tag Extraction: Automatically extract and verify titles, descriptions, robots tags across pages
- Structured Data Analysis: Inspect JSON-LD and microdata implementation at scale
- Canonical Tag Validation: Check for self-referencing canonicals and conflicts
- hreflang Verification: Validate international targeting setup automatically
4. Performance Waterfall Analysis
- Network Panel Automation: Identify render-blocking CSS/JS without manual inspection
- TTFB Analysis: Spot slow server response times across multiple pages
- Resource Optimization: Find oversized images, unused code, inefficient loading patterns
- Third-party Script Impact: Measure external widget performance automatically
5. Mobile & Responsive Testing
- Device Mode Automation: Test different viewport sizes without manual switching
- Touch Target Validation: Ensure buttons/links meet mobile usability standards
- Network Throttling: Simulate slow 3G/4G connections programmatically
- Mobile-first Indexing: Verify mobile experience matches desktop automatically
Where this goes next
Generally speaking I'm of the opinion that AI assisted apps will be routine in our world of work very, very soon. I also think that it's possible that one UI can rule them all. With MCPs you can access the SAAS services you're subscribed to, create prompt libraries for more complex, scripted procedures (more on this very soon), talk with the real world with MCPs for Gmail, Brevo - it's mind boggling when you begin to realise the power of the change we're witnessing.
Anyway, here's a cool idea to get you started with Claude Desktop and Chrome Dev Tools MCP
Performance Dashboard Creation
Prompt:
"Run a comprehensive performance audit on https://houtini.com/how-to-add-an-mcp-server-to-claude-desktop/
with chrome dev tools mcp and create an interactive dashboard as an artifact showing:

1. Core Web Vitals with color-coded status
2. Performance timeline with bottleneck highlights
3. Priority fix list with estimated impact
4. Before/after comparison capability
5. Export functionality for client reports

Make it professional enough to show to stakeholders."
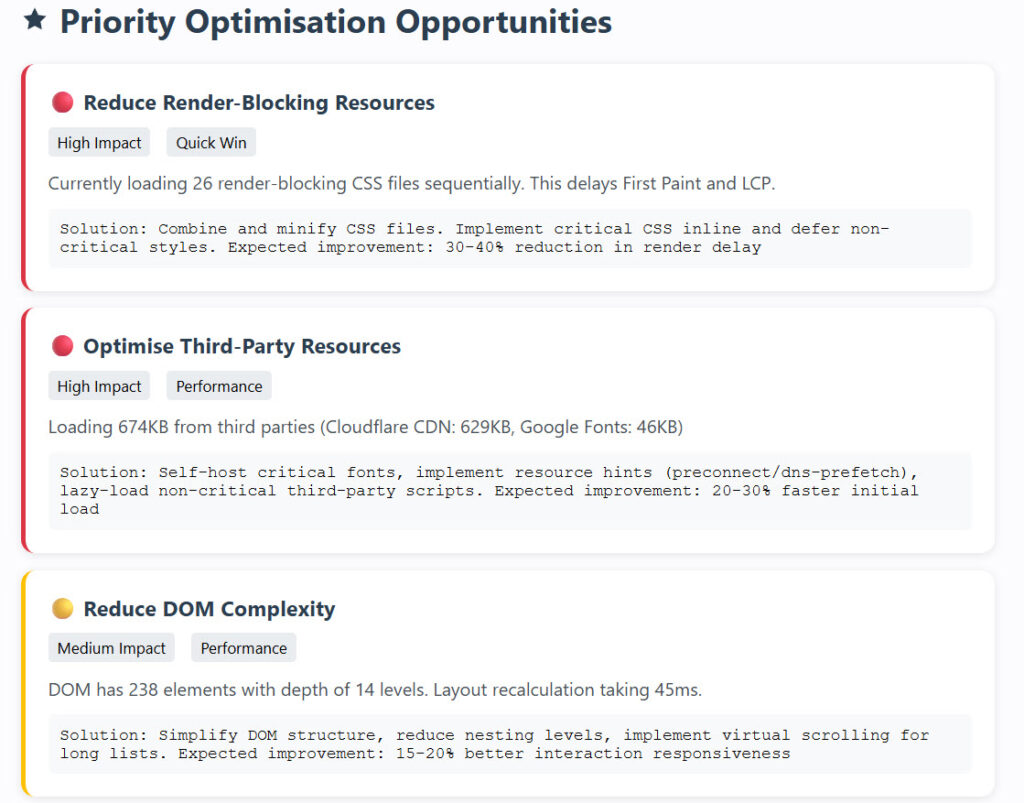
I'm pretty sure that prompt can be heavily refined but on the first pass it spits out a lot of useful insight. I think it looks pretty clear I have a lot to learn about CSS:
Competitive Comparisons
Prompt:
"Use chrome dev tools mcp to inspect and compare the JSON-LD implementation at these competitor product pages:

https://www.scan.co.uk/products/fanatec-csl-dd-qr2-8nm-wheel-base-8nm-torque-fluxbarrier-technology-hall-position-sensor
https://www.overclockers.co.uk/fanatec-csl-dd-bk180-qr2l-bundle-for-racing-sims-gam-crs-05527.html
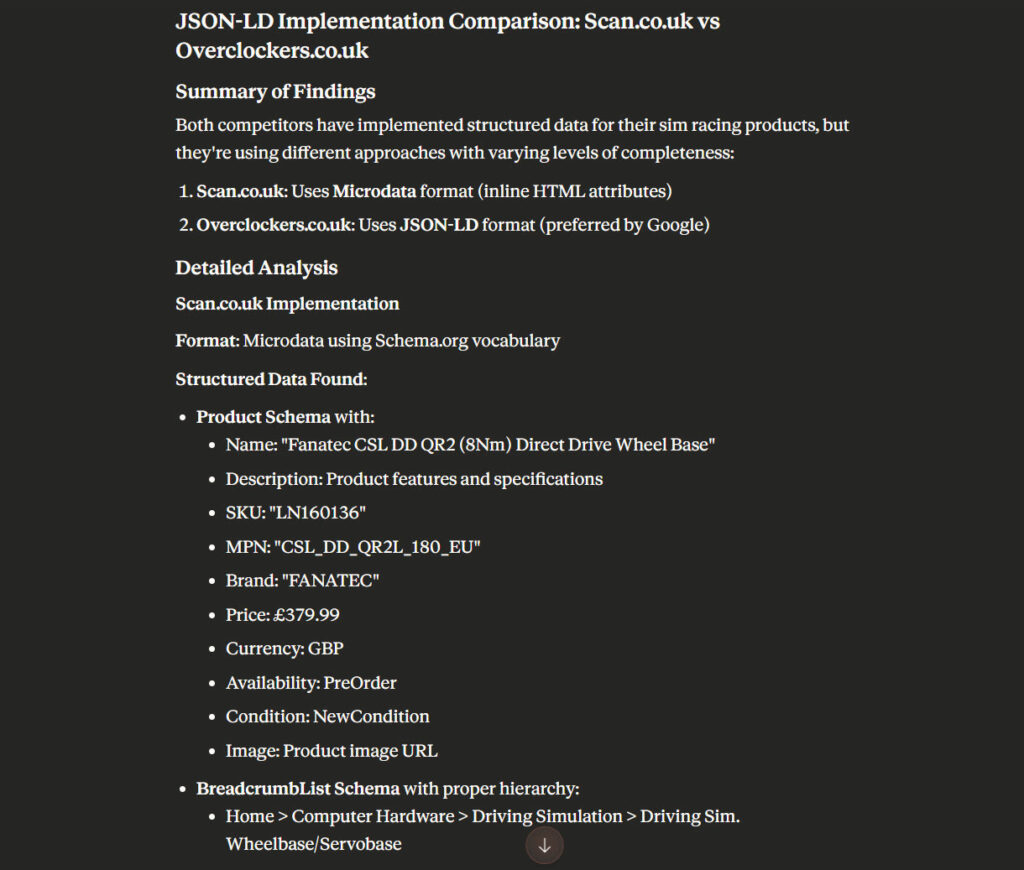
Both reports are far longer and the raw data is perfectly accessible. These ideas are easily developed - you could save the data as an artifact and add to project knowledge for analysis by another MCP, for instance. That is where we get into AI workflow territory, which I'm going to cover very soon. Enjoy!
Related Posts
Continue reading.
- How-to GuidesHow to Stop MCP Servers Eating Your PC: One Docker Gateway for Every Claude Client15 Aug 2026
- How-to GuidesHow to Use the Gemini API (and Why I Run It Next to Claude)15 Aug 2026
- AI ToolsHow to Do a Technical SEO Audit with Claude20 Jul 2026
- ExplainerWhat is a Marketing Engineer (and do you need one)?31 Aug 2026
- AI WorkflowsDynamically updating infographics and content (so you don't have to)28 Aug 2026
- Case StudiesThe parts Shopify Plus B2B doesn't do (and how we built them)28 Aug 2026