Tuning vLLM on a Modded 48GB RTX 4090: From 18 to 133 Tokens per Second
Three days of benchmarking vLLM on a modded 48GB RTX 4090: the quantisation trap that costs Ada owners 40% of their speed, the free 1.9x from speculative decoding, the KV compression that never served once, and what cutting 120 watts costs you. Every number measured, every failure kept.
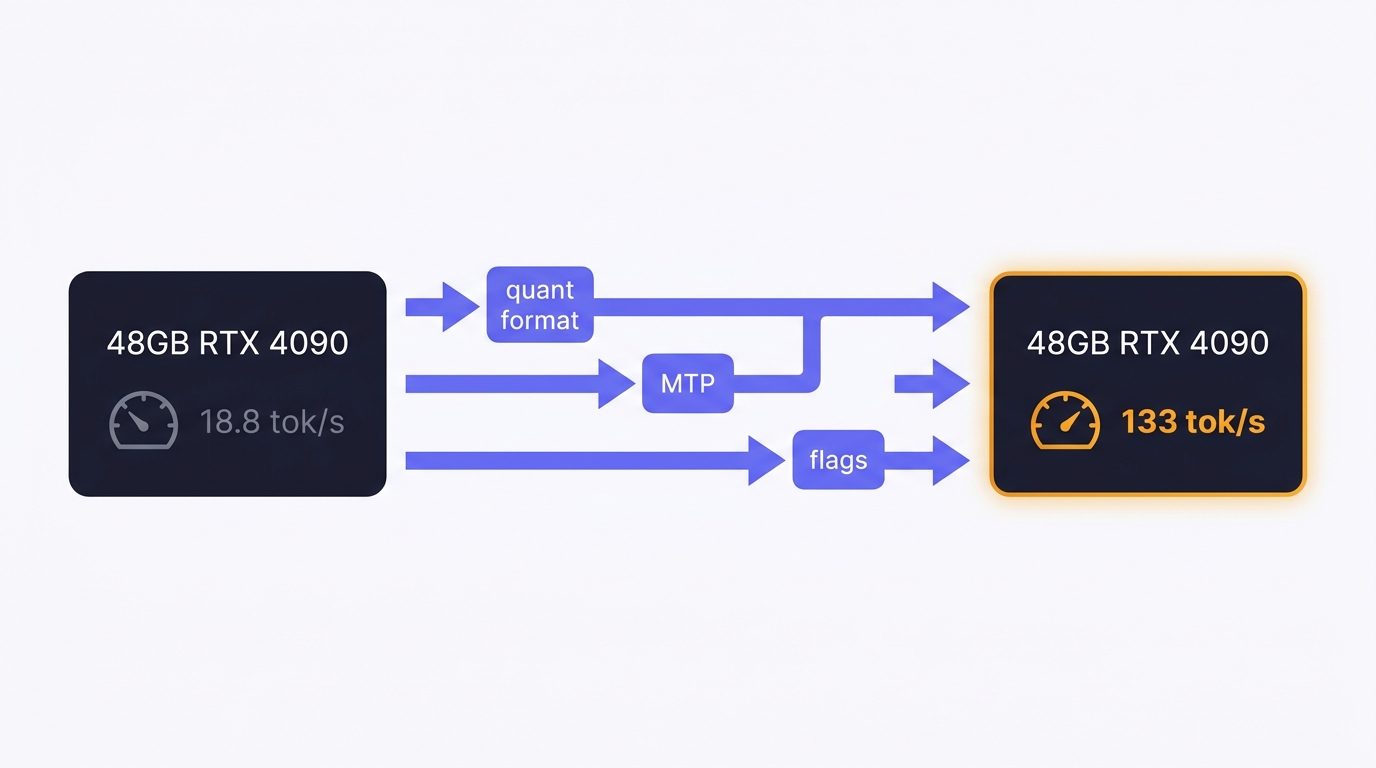
This started with a number that felt like an insult. I'd moved my local model stack from LM Studio to vLLM in Docker, loaded the official Qwen3.6-27B FP8 release on a modded 48GB RTX 4090, and watched it produce 18.8 tokens per second (tok/s). Everyone tells you vLLM is the fast option. Something was wrong, and it took me three days and about twenty recorded benchmark runs to work out what.
The short version: the same model on the same card now decodes at 60 to 66 tok/s, a 35B mixture-of-experts daily driver runs at 133, and the little extraction specialist tops 175. I've written up the story of the whole rebuild separately - why I left LM Studio, what the model stable looks like, how it connects to Claude. This piece is the engineering companion: every tuning finding with its number, the two failures that taught me more than the wins, and the methodology, so you can disagree with me precisely.
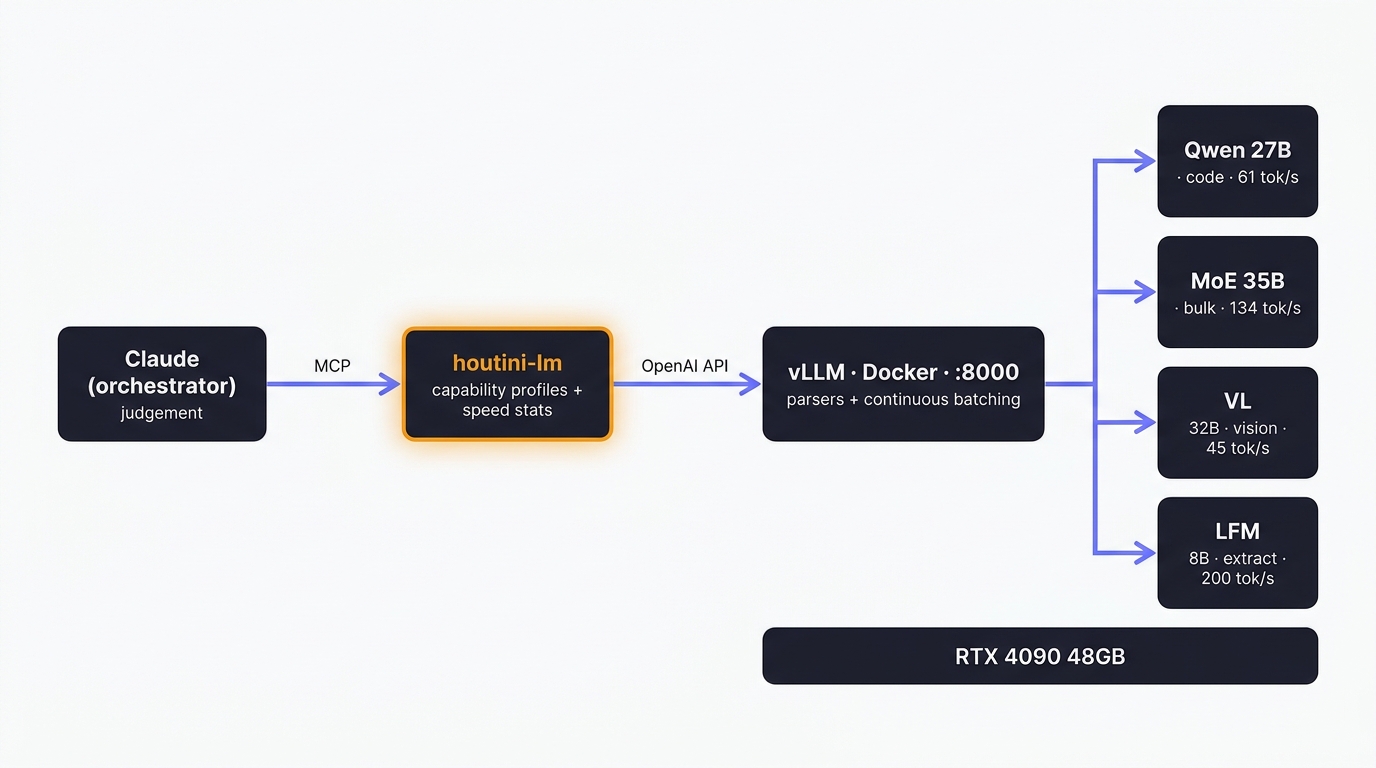
Why bother at all? The rig is a delegation sidekick - a local fleet that Claude hands bounded work to through houtini-lm , so the Anthropic API bill only pays for reasoning that earns it. Local tokens are free once the hardware exists. The constraint is speed and reliability, and that's what all of this was for.
Quick Navigation
The kernel trap |
The hallucination tax |
MTP |
The universal flags |
The empty response trap |
The measured fleet |
The MoE surprise |
TurboQuant |
The Windows tax |
The face-off |
Power limits |
Methodology |
Where to start
The kernel trap nobody warns you about
The 18.8 tok/s wasn't vLLM being slow. It was a quantisation format mismatch, and the log says so, quietly, if you know what to look for:
WARNING [fp8_utils.py] Using default W8A8 Block FP8 kernel config.
        Performance might be sub-optimal!
WARNING [fp8_utils.py] Config file not found at .../quantization/utils/configs,
        device_name=NVIDIA_GeForce_RTX_4090
Qwen ships its official FP8 checkpoints in block format (weights quantised in 128x128 tiles). Block-FP8 has beautifully tuned kernels for Hopper and Blackwell datacentre cards, and none for Ada (SM89), which is the architecture every 4090 owner is sitting on. vLLM falls back to a generic kernel and quietly loses you around 40% of your decode speed. I checked all four official Qwen FP8 models I had on disk - every one carries weight_block_size in its quantization_config, and every one hits the same fallback. Reddit's r/LocalLLaMA warns that block-FP8 "breaks or falls back to severely unoptimized kernels" on consumer cards; my measurements agree with them.
The fix isn't a flag. It's a different file:
- AWQ INT4 runs on Marlin kernels, which are superbly tuned for Ada. cyankiwi's AWQ build of the same 27B took decode from 18.8 to the low thirties on weights alone.
- FP8-dynamic (per-tensor, the RedHatAI style) also runs properly on Ada. It's specifically the block variant that doesn't.
- QAT W4A16 - Google's quantisation-aware Gemma releases - same Marlin path, and because the model learned to live at 4-bit during training, quality tends to hold up better than post-hoc quants. Measured on the 31B : 42 tok/s against 17.8 for the FP8-dynamic build of the same model, 2.4x from the file choice alone.
Same model, same card, different file on disk. That was most of my missing speed, and it produces the one rule I'd put at the top of the page: check the quant format before you download anything. Open the model's config.json and look for weight_block_size. If it's there and you're on consumer hardware, find another quant.
There is a trade, which the numbers show plainly. Marlin INT4 prefill is compute-heavier: the AWQ 27B chews through a cold 16k-token prompt at roughly 1.8k tok/s where the FP8 build manages 3.9k. Faster decode, slower cold start. Prefix caching (below) makes that mostly irrelevant for orchestrated work, but if your workload is one-shot giant prompts, the FP8-plus-MTP fallback at 36 tok/s may suit you better. I keep both presets.
The hallucination tax on model research
I shortlisted candidate models and quants with Gemini's grounded search, which works well, with one discipline bolted on: every repo ID gets verified against the Hugging Face API before anything downloads. That check caught three confident inventions - a "Qwen3.6-VL-27B" that doesn't exist (the real vision line is Qwen3-VL), a "Qwen3-Coder-14B" that has never existed, and a plausible-looking vLLM script path that was wrong. AI-assisted research is fine. Unverified AI-assisted research downloads 30GB of the wrong thing at 2am.
One more thing I learned the tedious way: the Hugging Face API has no benchmark endpoint. Leaderboard scores live in Spaces and datasets, so "what does HF say is best" is not a one-call question, whatever a grounded search result implies. And the generation history matters more than it used to - Qwen folded coding into the mainline models after 3.0, so Qwen3.6-27B dense is the coder now. There is no separate Coder-32B to hunt for, though a search assistant will cheerfully name one.
MTP: the free 1.9x
Qwen3.6 models ship with an embedded multi-token-prediction head, and vLLM supports it natively:
--speculative-config.method mtp --speculative-config.num_speculative_tokens 2The draft head guesses the next couple of tokens and the full model verifies them in one pass. Decode is memory-bound, so verification is nearly free. Measured on the dense 27B: 19 to 36 tok/s on the official FP8. Stacked on the AWQ quant: 60.9, later 66.3 after host tuning. That's near-perfect multiplicative stacking (1.7x from the quant, 1.9x from MTP), which pleased me more than it probably should have.
Two caveats from testing rather than reading. The community AWQ quant I use kept the MTP head - the architecture resolves as Qwen3_5MTP - but plenty of AWQ conversion scripts strip it, so check before assuming yours has one. And the research consensus says the acceptance rate falls off a cliff past two or three speculative tokens; I ran everything at k=2 and the k=3 comparison is still on the to-do list. It lost its bench slot to the power sweep.
Three flags that never regressed
Every model I tested got the same baseline, because these three improved every single one with zero regressions:
--enable-prefix-caching --max-num-batched-tokens 8192 --max-num-seqs 16Prefix caching is the one that matters for delegation work. When the prompt prefix is byte-identical - which orchestrated calls mostly are, because the system prompt and tool definitions don't change between requests - the engine skips prefill for the cached portion entirely. Repeat time-to-first-token on a 16k prompt: 3.92 seconds down to 0.08 on the small coder, 8.76 down to 0.07 on the vision model. The catch is that "byte-identical" is a client-side responsibility. Put a timestamp in your system prompt and you've silently switched the cache off. That design rule is now written into houtini-lm's docs, because I did exactly that.
--max-num-seqs 16 deserves its own paragraph. vLLM defaults to reserving 256 concurrent sequence slots, and every reserved slot multiplies the KV cache allocation. I never run more than four requests in parallel. Cutting the reservation freed gigabytes of VRAM for context instead. The llama.cpp crowd found the same thing independently - a widely-shared post about fitting 150k context on a 12GB card turns out to hinge on -np 1, that ecosystem's version of the same flag (it defaults to 4 parallel slots, which quietly quadruples the KV budget). Two ecosystems converging on the same fix from different directions is about as strong a signal as this hobby produces.
The third flag, chunked prefill at 8192 batched tokens, just keeps Ada saturated during long-prompt prefill. No drama, small win, never regressed.
Thinking models and the empty response trap
Qwen3.6 thinks before it answers - somewhere between 100 and 800 reasoning tokens before any visible output, all charged against max_tokens. Set max_tokens=200 and you get HTTP 200, empty content, no error. It looks exactly like a broken model. It's a client bug, and I spent longer than I'd like on it before the penny dropped.
Two rules came out of this. First: max_tokens is a runaway brake, not a throttle. Unused budget costs nothing, so set it generously - I use 8k for tool execution and 32k where generation or thinking is involved. For scale, a 1,000-line source file is around 13k tokens; an 8k cap physically cannot hold a module rewrite, and the failure mode is silence, not an error. Second: when Claude is orchestrating, Claude is doing the thinking, so the local model shouldn't repeat the work. Thinking is switchable per-request:
{ "chat_template_kwargs": { "enable_thinking": false } }Measured on an identical tool call: 3.7 seconds with thinking on, 0.8 with it off, same output either way. No-think is the correct default for delegated work, and this finding became a merged PR to the houtini-lm MCP the same week.
What the measured fleet looks like
Every row below comes from the same harness on the same machine at stock power: decode is single-stream, 256 tokens, temperature 0; prefill and cold TTFT are a ~16k-token prompt; repeat TTFT is the same prompt again, which is really the prefix cache doing its work.
| Model | Quant | Decode tok/s | Prefill tok/s | Repeat TTFT | 4-way agg | Notes |
|---|---|---|---|---|---|---|
| LFM2.5-8B-A1B | BF16, 1B active | 176 | 14.9k | 0.05s | 266 | fastest thing on the rig; clean JSON extraction |
| Qwen3.6-35B-A3B | AWQ4 MoE | 132.6 | 13.6k | 0.19s | 398 | the daily driver; casual-grade vision |
| Qwen3.6-27B | AWQ4 + MTP | 60.9-66.3 | 1.8k | 1.1s | 134-217 | dense accuracy pick; Marlin prefill is the trade |
| Qwen3-VL-32B | AWQ4 | 45 | 1.9k | 0.07s | 171 | precision OCR, character-exact in my tests |
| Gemma 4 31B | QAT W4A16 | 42 | 2.1k | 0.13s | 134 | no thinking phase; replies start immediately |
| fable-coder-12b | BF16 | 34.1 | 5.3k | 0.08s | 114 | fast TypeScript; face-off winner among smalls |
| Qwen3.6-27B (the trap) | official block-FP8 | 18.8 | 3.9k | 4.7s (no cache) | 81 | kept for reference |
Two things worth reading out of it rather than past it. The trap row's repeat TTFT is 4.7 seconds because that first run predates the universal flags - no prefix caching - so it doubles as the before picture. And the 27B's 1.1-second repeat TTFT against the others' sub-0.2s is the Marlin trade showing up even on cached prompts; it's still an order of magnitude better than its own 10-second cold start.
The MoE surprise
The best single row in my results file. Same quant family, same card: the dense 27B decodes at 60.9 tok/s, and Qwen3.6-35B-A3B (35 billion parameters, about 3 billion active per token) decodes at 132.6. The bigger model is twice as fast.
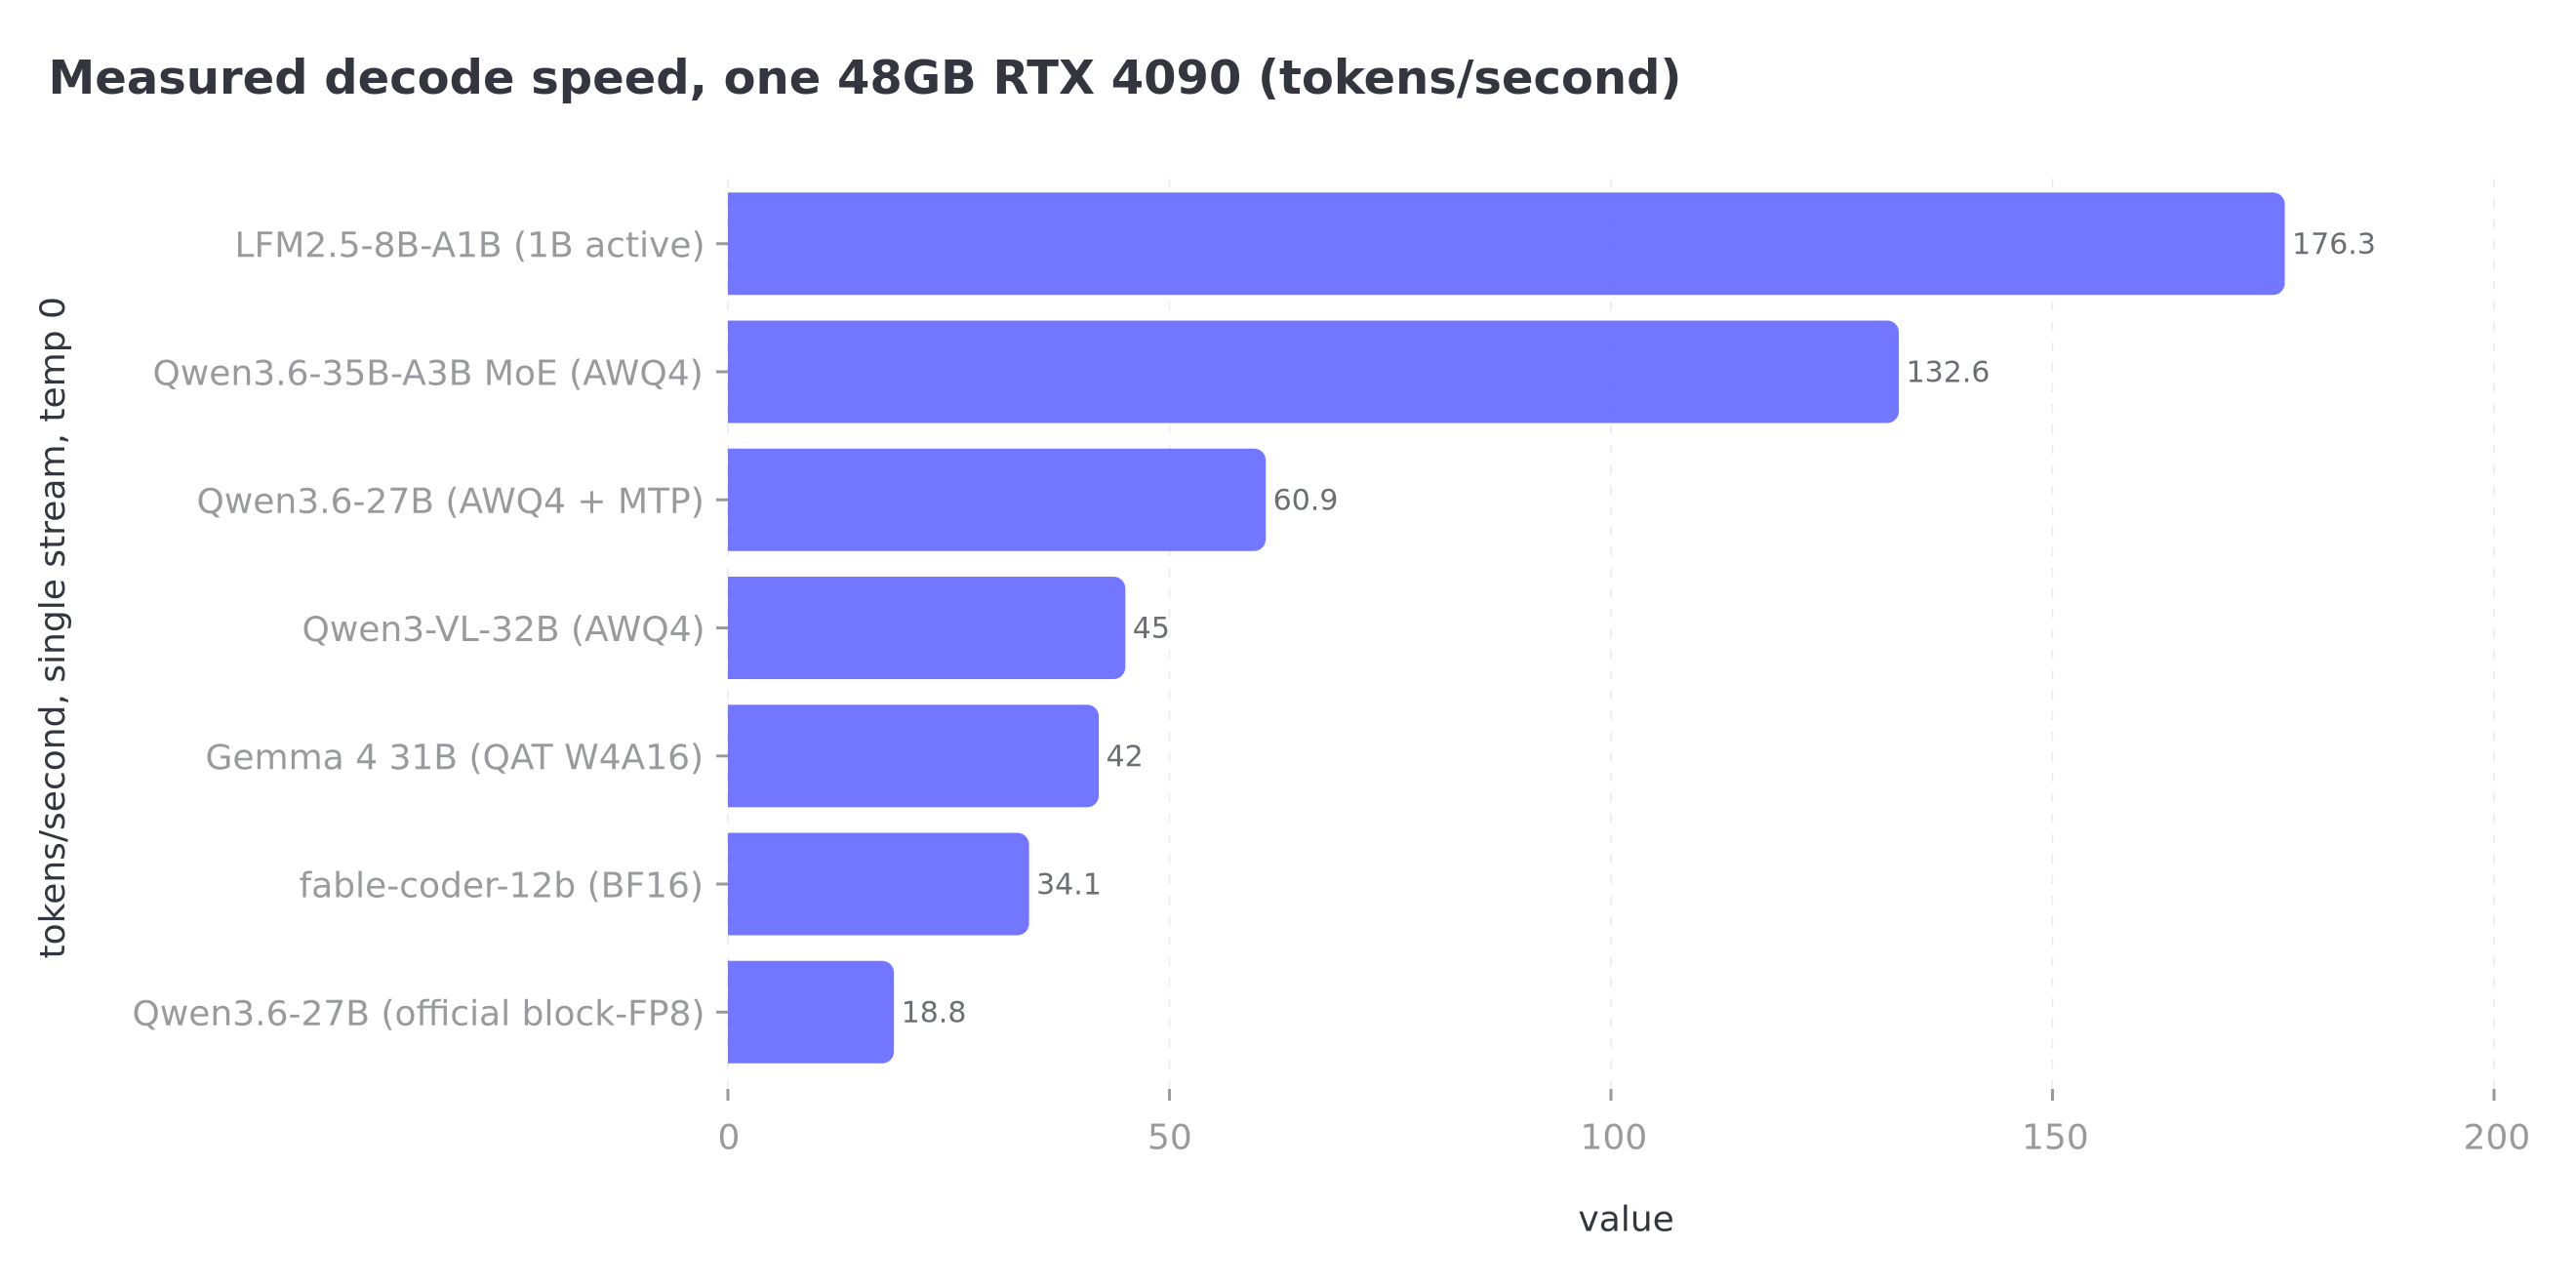
The explanation fits in a sentence: decode speed is memory bandwidth divided by bytes touched per token, and the MoE touches about a ninth of the bytes. It even shrugged off the block-FP8 kernel trap that crippled the dense model - 87.5 tok/s on the "bad" quant - because so little of the model is read per step that the kernel penalty barely registers. Parameter count tells you roughly what a model knows; how fast it runs is set by the bytes each token touches, and the two have drifted so far apart that sizing up a model by its headline parameter count is a habit worth breaking.
The dense model keeps its job, mind. On hard reasoning the 27B is noticeably stronger per parameter, and an RTX 6000 owner in a thread I was reading put the split more bluntly than I would: the 35B "can't follow even detailed spec" while the dense model is better at coding but many times slower. My routing table agrees with him. The MoE does the bulk work, the dense model gets the calls where a wrong answer is expensive, and neither replaces the other.
One late bonus: the 35B has working vision, courtesy of Qwen3.6's unified architecture. Casual-grade only - it read my "VISION CHECK 88" test image as "visioncheck88", content right, casing and spacing lost - but for a quick screenshot glance it saves loading Qwen3-VL-32B , the dedicated vision model, which stays around for character-exact work.
TurboQuant: the one that never served
Now the failure section, which I'm keeping because it cost me an evening and the write-ups that omit this sort of thing are why everyone's expectations are miscalibrated.
TurboQuant is 4-bit KV cache compression: roughly 3.8x more context in the same memory for about 2.7% perplexity cost, community-tuned for consumer cards. It's the headline technique of the article that started this whole project, and on paper it's exactly what a 48GB card wants. On this rig, on vLLM 0.25.1, it never served once. Both model runners refused, for different reasons:
V1 runner:  ValueError: Unknown TurboQuant cache dtype: 'auto'
V2 runner:  RuntimeError: UVA is not available
The V1 failure is a known upstream bug (vllm#40094) that matches a reported Qwen3.6 case. The V2 runner needs unified virtual addressing, and WSL2 doesn't expose it. Both doors closed on the same evening. It's also incompatible with MTP even where it does load, so I'd have been choosing between speed and context anyway. I added our repro to the upstream issue (a new hardware-class variant: Ada, WSL2, MTP draft path) and moved on.
The consolation surfaced while I was totting up what I'd lost. Qwen3.6 has a hybrid attention layout: only 16 of the 64 layers keep full KV cache. At plain fp8 KV, the full 262k context costs about 8.6GB. On a 48GB card, I didn't need the compression at all - the max-context preset now ships fp8 KV plus MTP, and decodes at 64 tok/s with the entire 262k window addressable. Measured, not projected.
The moral I took: research-recommended and measured-working are different universes, and the gap this time was two independent upstream bugs deep. Retest on 0.26 is in the diary.
What Windows costs you
Everything here runs in Docker Desktop under WSL2, which the practitioner consensus prices at 5 to 15% versus native Linux. I'm inside that band, and I'd rather pay it than dual-boot. But the sharp edges are real, and three startup failures taught me the pattern before I saw it written anywhere:
- Model Runner V2 needs UVA, which WSL2 doesn't provide. Dense text models run on V2. MoE and multimodal models crash at startup unless
VLLM_USE_V2_MODEL_RUNNER=0. Safe default: 0. .wslconfigmatters more than I expected. Cap the memory, setprocessorsto your P-core thread count only (E-core scheduling jitter shows up as token latency),swap=0so an over-budget model fails honestly instead of silently paging milliseconds into seconds, andnetworkingMode=mirroredto skip the NAT virtual switch on every streamed token. That batch of changes measured about +7% on decode - 60.9 to 66.3 on the crown config - plus stability I could feel.- The container needs room:
shm_size: 16gand unlimited memlock, or vLLM's inter-process communication eventually Bus-errors on Docker's 64MB default. - Hardware-accelerated GPU scheduling off. HAGS and vLLM's pre-allocated VRAM block fight, and neither wins.
- CPU offload is off the table, permanently. WSL2 caps pinned host memory at an opaque limit, which killed my idea of running DeepSeek-scale models with weights spilling to system RAM. Size the model for VRAM or don't run it. (The frontier-scale models wouldn't fit 96GB anyway, at 284B-plus even in aggressive quants.)
The face-off, briefly
The speed table doesn't tell you whether the code compiles, so I ran the small coding models head-to-head on one real task: a typed MCP tool handler for a Cloudflare Worker, Zod validation, sanitised errors, no any. Judged on compiling correctness against the spec.
The full story is in the journey update , but the scoreboard bears repeating: a 9B with 946k downloads and a 52% SWE-bench score shipped TypeScript that doesn't compile (an undeclared env free variable) and leaked err.message against an explicit instruction. A Cohere 30B MoE with a spectacular 174 tok/s engine spent its entire 4,000-token budget deliberating about what the question meant and never wrote the code. The winner was an unbenchmarked community 12B - yuxinlu1's fable-coder , a distill of frontier coding traces onto Gemma - which produced a correct, compiling, spec-faithful handler in 12.3 seconds, at what I'd judge 95% of the quality my dense 27B produced in 55 seconds with thinking enabled.
A million downloads and a benchmark pedigree, beaten on a 20-line real-world task by a model nobody has scored. An afternoon of testing on your own workload tells you more than any leaderboard will.
Dropping 120 watts costs almost nothing
These modded 48GB cards are clamshell builds - double the memory chips on the same PCB - so they run warmer than stock and thermals deserve some respect. The hypothesis: decode is memory-bandwidth-bound, so cutting the board power limit from the stock 450W should cost near-zero decode speed and only show up in compute-bound prefill. I ran the full fleet again capped at 330W to find out.
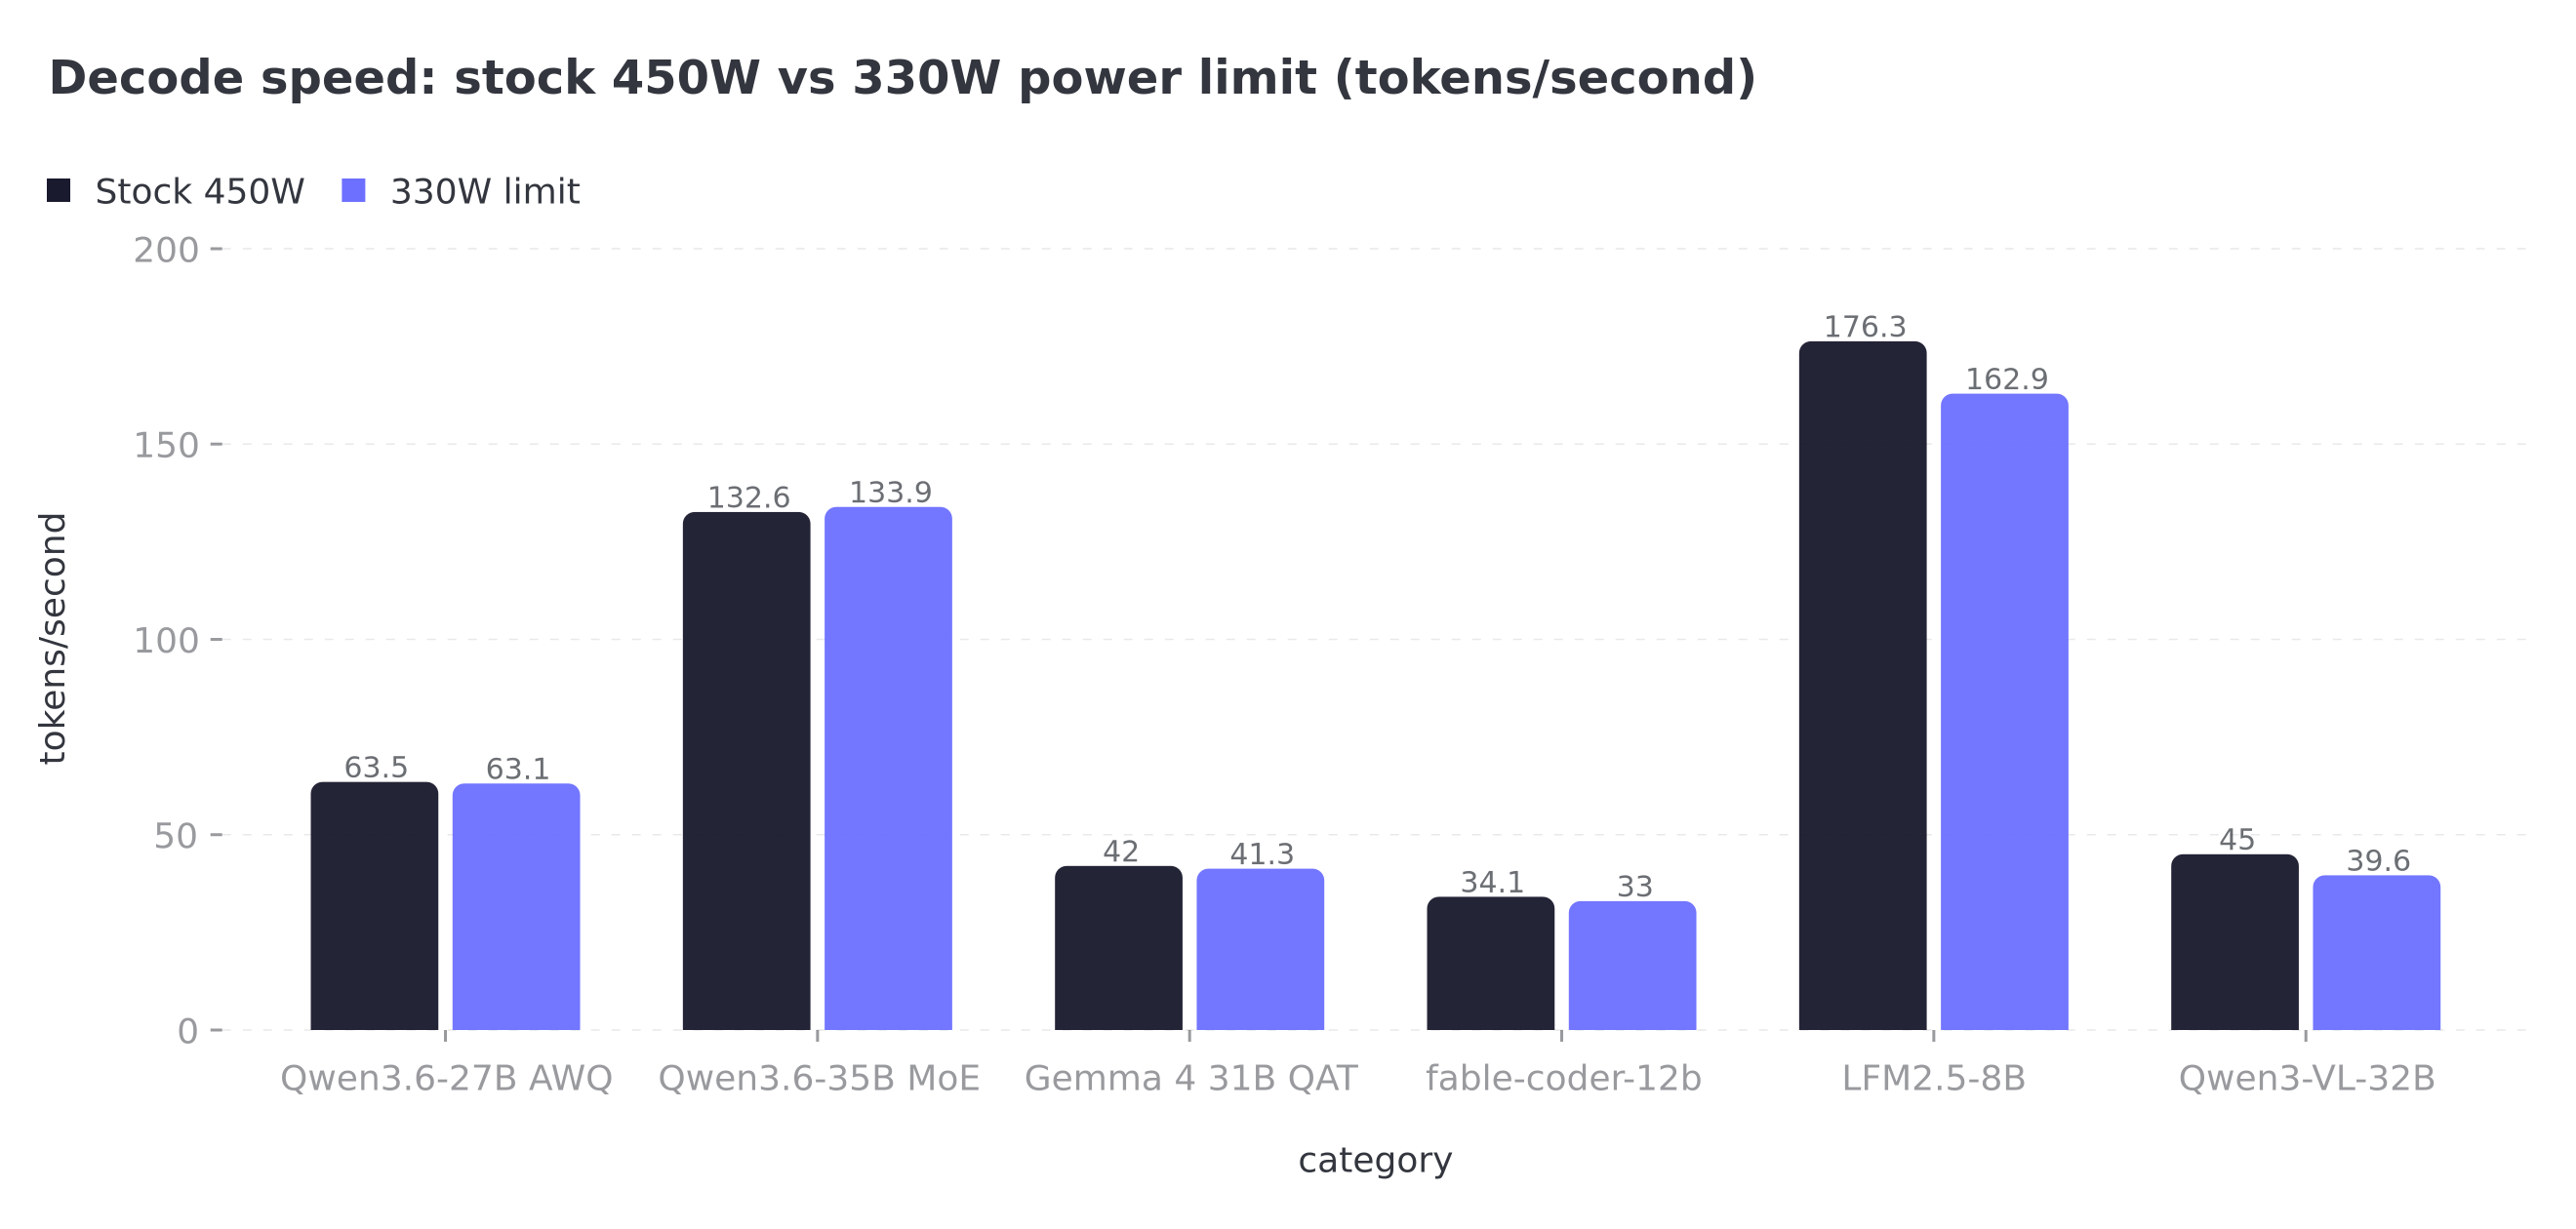
For the big models, the hypothesis held almost embarrassingly well. The 35B MoE: 132.6 tok/s stock, 133.9 capped - run-to-run noise. Gemma 31B QAT gave up 1.7%. The dense 27B sat between 63 and 66 stock and 63 to 64 capped, a few percent at the very worst. That's a 120W cut per card for a cost the daily drivers can't reliably measure.
The exceptions are the interesting bit. LFM2.5-8B-A1B , the fleet's speed record holder, dropped 7.6% (176.3 to 162.9) - with only 1B active parameters it's far less memory-bound per token, so the clock cut shows. And the vision model lost 12% (45 to 39.6), with its compute-heavy Marlin prefill hurting more still. The pattern is tidy: the more memory-bound the model, the freer the power cut.
What settled the policy wasn't the benchmarks, though. It was the power supply. The second card takes this rig to two 4090s on a 1200W PSU, and 4090s throw microsecond transient spikes well above their TDP - synchronised dual-card prefill is the worst case, and those transients are what trip over-current protection on a tight PSU. The arithmetic:
| Dual-card setup | GPU draw | All-in (with system) | On a 1200W PSU |
|---|---|---|---|
| 2x 450W stock | ~900W | ~1100W | OCP-trip territory |
| 2x 330W capped | 660W | ~860W | ~340W transient headroom |
So 330W is now the standing policy: cooler clamshell VRAM, spike headroom for card two, and the models that matter didn't notice. The only change I'd registered at the desk before the numbers came in was less heat coming off the card, which rather gives the game away.
One gotcha that would have quietly poisoned every number after it: nvidia-smi -pl is volatile. Every reboot silently resets the limit to 450W, so a 2am Windows Update reboot invalidates your week of measurements without a single error message - drift-shaped error, exactly the kind the harness exists to catch. The fix on Windows is an elevated at-logon Task Scheduler job that reapplies the cap, and the bench script now verifies the limit before recording anything.
How these numbers were made
Because a benchmark you can't interrogate is just an opinion with digits. The harness is about 80 lines of PowerShell against vLLM's OpenAI-compatible endpoint. Each run measures five things: single-stream decode (256 tokens, temperature 0), cold time-to-first-token on a ~16k prompt, the same prompt repeated (really a prefix-cache test), decode with that context loaded, and aggregate throughput across four parallel requests. Every run appends a JSON line carrying the full server config, so any number in this piece traces back to the exact flags that produced it. Speed alone doesn't earn a model its place - each one also has to return a real parsed tool_calls array from a structured tool-calling request, and the vision models have to read text out of an image I generated locally. One variable per run. Failures go in the file too.
The limitations, stated rather than buried. These are single runs, not averages - spot-checked variance was 2 to 5%, but I haven't characterised it properly. Cold TTFT is only valid on the first run after an engine start; after that the fixed prompt hits the prefix cache, which I discovered by producing a nonsense number and having to work out why. The quality checks are workload spot-checks on my tasks, not accuracy benchmarks. And it's one machine, one driver, one vLLM version. Treat the relative differences as solid and the absolute numbers as mine. The living results are public - our model testing page is the front door, and the routing they feed runs through houtini-lm . And they keep moving: a scheduled sweep re-runs the fleet weekly at the standing power policy and updates the figures from the same harness, so the numbers here age rather better than benchmark posts usually manage.
What I'd do first on your rig
If you're on Ada hardware and your vLLM numbers feel wrong, this is the value order from three days of testing, and the whole list is an afternoon once you know what you're looking for:
- Check your quant format.
weight_block_sizein the config.json means block-FP8 means the kernel trap. Swap to AWQ, FP8-dynamic, or QAT. This was 1.7x on its own. - Turn on prefix caching and cap your sequence slots.
--enable-prefix-caching --max-num-batched-tokens 8192 --max-num-seqs 16. Free VRAM, near-instant repeat prompts, no regressions anywhere in my fleet. - If your model has an MTP head, use it. 1.9x, and it stacks with the quant fix.
- If it's a thinking model behind an orchestrator, turn thinking off per-request and set
max_tokenslike a brake, not a throttle. - Then sort the host. The
.wslconfigand container settings were worth ~7% here, and a 330W power cap costs the memory-bound models nothing while buying thermal and PSU headroom - just make the cap survive reboots, or it quietly un-sets itself and takes your baseline with it.
The routing that puts these models to work - which task type goes to which preset - runs through houtini-lm , and using a local LLM to audit your codebase shows the delegation pattern on a real job. If you're weighing up hardware for this, the GPU guide covers the buying side, and if you don't run Claude yet, a free week of Claude Code is the cheapest way to find out what an orchestrator does with a fleet like this.
The second card is on the bench as I write this, so the next set of numbers gets to answer the tensor-parallel question - the researched claim is 0.6 to 0.75x scaling per card over PCIe, and I've already learned enough this month to not take the research's word for it.
Continue reading.
Giving Claude a Local Sidekick: a vLLM Journey Update
I want Claude to have a powerful local sidekick through houtini-lm. I'm not there yet, but this month I got noticeably closer - a vLLM rebuild, a benching spree on the 48GB 4090, and a face-off that deleted two models in an evening.
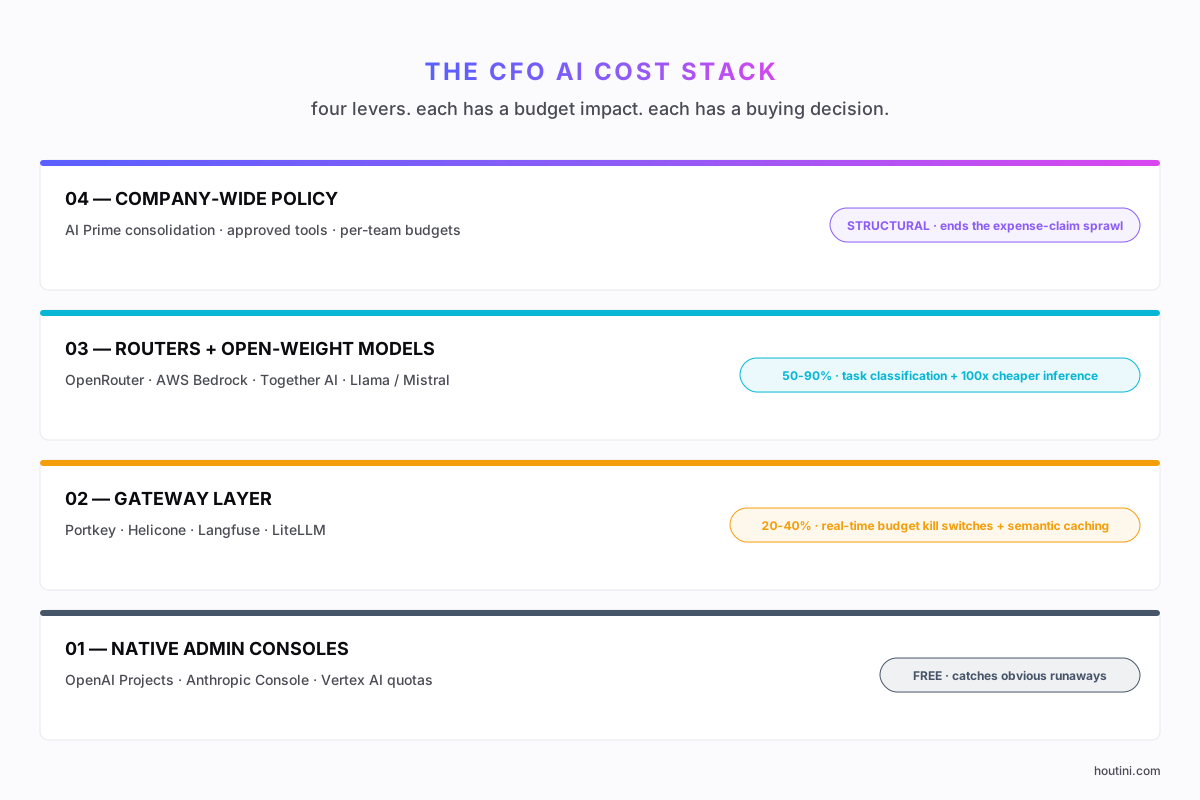
AI for the CFO: variable cost, vendor sprawl, and the playbook that ends the surprise bill
Uber reportedly provisioned 5,000 engineers with Claude Code in December 2025. By April 2026 it had burned the entire annual AI budget in four months. Variable cost is the new shape of the AI line item, and the CFOs who are getting it under control are running the same four-lever playbook. Here is what is on each lever, which platforms are credible, and what to ship in the next ninety days.
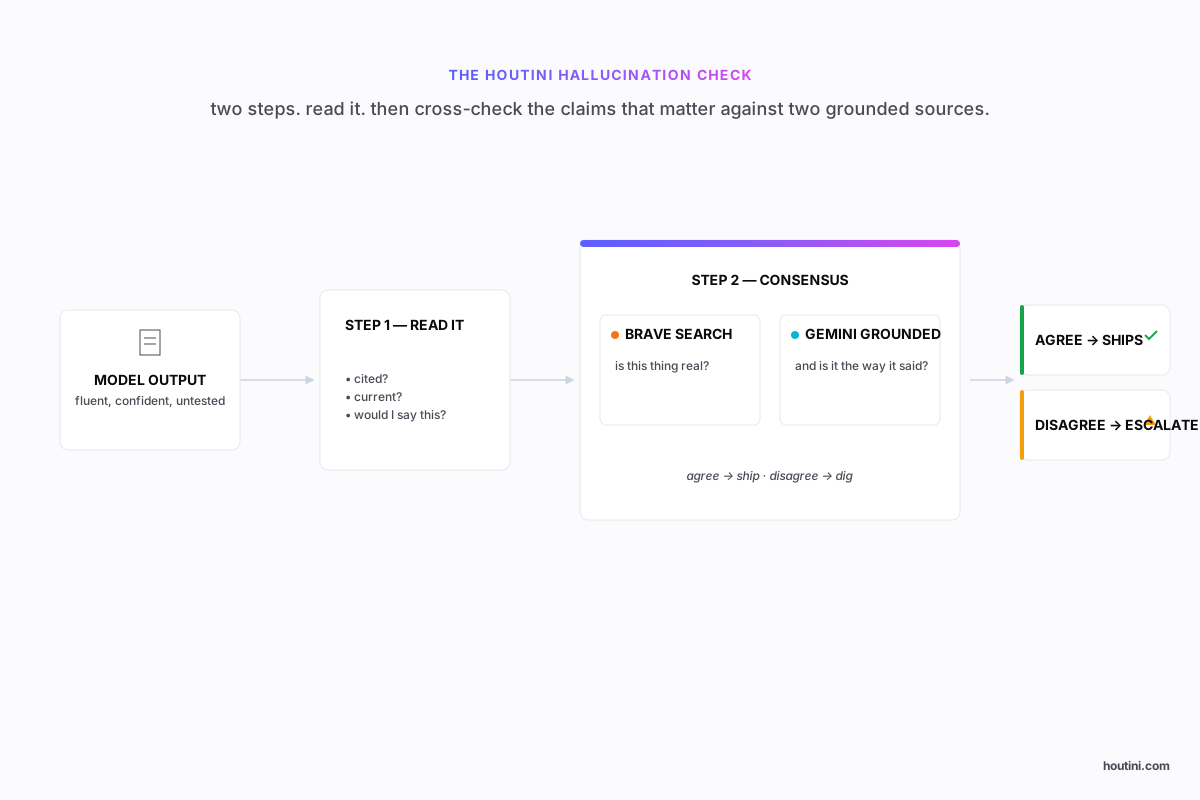
AI hallucination, and the boring discipline that stops it being a problem
You have read about lawyers citing made-up cases and chatbots inventing refund policies. The fix is not a new platform or a clever prompt. It is the most boring discipline in software: read what came out and check the bits that matter against a second source. Here is what hallucination is, how we run a Houtini-grade check on every claim, and what would change if your team did the same.